Article Text

Abstract
Introduction We compared sensory nerve conduction studies (NCS) using surface and near-nerve recording electrodes in 53 patients with clinical probable painful neuropathy. Our aim was to validate the use of both recording techniques in that limited patient group.
Methods Patients had sensory NCS using two established recording methods and quantitative sensory tests (QST). We compared normalised amplitudes of sensory sural nerve action potentials (SNAP) and sensory thresholds and used receiver operated curve (ROC) analysis of absolute SNAP amplitudes to find discriminatory levels predicting abnormal sensory thresholds.
Results Mean sural SNAP z-scores differed depending on recording techniques (surface −1.0: SD 1.9; near-nerve −2.5: SD 1.7) with a numeric mean difference of −1.49 (Bland-Altman test: CI −1.872 to −1.12) with surface technique giving the z-value closest to zero. We documented a significant bias between the methods. Fifteen patients (28.3%) and 30 (56.6%) patients had abnormal results, respectively (χ2 test: p<0.001).
Sural SNAP amplitudes correlated significantly with vibration thresholds using the near-nerve (p<0.02) but not using the surface technique (p=0.11).
ROC analysis gave an optimal discriminative value of SNAP amplitudes for each QST measure, which were similar to our lower limit of normal values from investigating normal controls using near-nerve but not surface recording.
Conclusion In patients with probable painful neuropathy, choosing sensory NCS technique introduces a bias in the diagnostic outcome. Differences in test performance suggest that using a normal sural NCS alone to delineate small fibre neuropathy from mixed neuropathy could result in poorly defined diagnostic groups.
- neuropathy
- neurophysiol
- clinical
Data availability statement
Data are available on reasonable request.
This is an open access article distributed in accordance with the Creative Commons Attribution Non Commercial (CC BY-NC 4.0) license, which permits others to distribute, remix, adapt, build upon this work non-commercially, and license their derivative works on different terms, provided the original work is properly cited, appropriate credit is given, any changes made indicated, and the use is non-commercial. See: http://creativecommons.org/licenses/by-nc/4.0/.
Statistics from Altmetric.com
Key messages
What is already known on this topic
Using subdermal recording needles gives a higher sensitivity to detect large fibre dysfunction in neuropathy than surface recording electrodes as shown in previous studies.
What this study adds
We found this to represent a bias across all amplitudes of sural nerve action potentials in patients with painful neuropathy. We also found the amplitudes of subdermal nerve recordings to have better predictive properties in patients with abnormal sensory function towards vibration and temperature changes than the surface recordings.
How this study might affect research, practice or policy
We argue that surface recordings could underestimate the large fibre physiopathology in painful neuropathy and that this could affect the discrimination between mixed neuropathy and predominantly small fibre neuropathy. Indirectly, normative values for intraepidermal nerve fibre density could suffer from this bias giving erroneously reduced lower limits.
Introduction
Patients presenting with symptoms suggesting a distal symmetric sensory polyneuropathy need evaluation to secure a definite diagnosis. Through the combined symptoms, clinical findings and neurophysiology testing, this is usually straightforward, and, in addition, progression of the disease can be followed.1–3 We increase the certainty of this diagnosis through predefined levels with a possible diagnosis supported by symptoms alone, a probable diagnosis supported by symptoms and clinical findings and a definite diagnosis supported by laboratory tests showing loss of functioning nerve fibres.
Sensory nerve conduction studies (NCS) provide the laboratory support for a definite neuropathy diagnosis4 by recording sensory nerve action potentials (SNAP) from the skin surface or through monopolar needles. SNAP amplitude correlates with sensory thresholds, and in the case of subdermal electrodes, results correlate with sensory signs and distal pressure-induced evoked nerve potentials in cisplatin sensory neuropathy5 and with the number of thick (>7 µm) myelinated sensory nerve fibres.6–8
In patients with predominantly painful symptoms, a probable diagnosis also requires the presence of both symptoms and objective findings (NeuPSIG; Neuropathic Pain Special Interest Group under the International Association for the Study of Pain,9 while a definite diagnosis requires a diagnostic test supporting the loss of functioning nerve fibres. This confirmation could come from NCS or from tests reflecting the loss of small diameter somatic or autonomic nerve fibres.
In this same group of patients, diagnostic criteria for small fibre neuropathy (SFN) includes results from quantitative sensory testing (QST) and intraepidermal nerve fibre density (IENFD) measurements together with the clinical symptoms and signs.10–13 Those criteria adhere to NeuPSIG criteria—but only if QST abnormalities reflect axonal loss.
Both the Concensus Criteria and the NeuPSIG criteria rely on the sural nerve sensory NCS to document the presence or absence of large fibre loss, respectively. In our study, we focus on how valid the NCS methods are to direct the diagnostic pathway towards confirmation.
In that context, it becomes important to validate the NCS recording technique in this patient group. The near-nerve recording method reflects the axonal loss—regardless of changes beyond the nerve itself—due to a prespecified proximity of the electrode to the nerve. Using surface electrodes, change in distance from the nerve to the skin surface or change in skin conductance from neuropathy could both impact the resulting signal, introducing a bias in the evaluation of the results.
Previous studies in diabetic neuropathy have found that near-nerve techniques are more sensitive than surface recordings.14 15 In this study, we aim to examine the validity of the two recording techniques beyond the sensitivity. We examine how the SNAP amplitude from both techniques correlate to sensory thresholds to ascertain whether a systematic bias is present. Further, we assess the discriminative performance of SNAP amplitudes. If both recording techniques were equally useful, they would both be able to predict abnormal sensory function at an SNAP amplitude close to the lower limit of normal values for the technique. Lastly, we put the findings in clinical context. Diagnostic criteria gives SNAP amplitudes a central role in directing the diagnostic pathway of the patient towards a clinical definite diagnosis though either a full small fibre evaluation or a more limited detection of small fibre loss using QST for temperature.
Methods
As part of our clinical practice, we prospectively examined consecutive patients referred from March 2010 to March 2018 with a history of symptoms and signs in the distal part of the legs for the presence of painful neuropathy. Referrals were overwhelmingly from neurologists in hospital settings or private practice and to a lesser degree from other specialists. We were not involved in determining the etiologies of the neuropathy, and due to data restrictions we were not allowed to collect those data retrospectively. Information from the referral charts, which often display suspected etiologies, reported very few patients with diabetes and most were without suspected underlying conditions. The patients had prior surface NCS without signs of large fibre neuropathy and had a referral for small fibre evaluation. During the recruitment period, we did not perform skin biopsies for IENFD in the laboratory.
Nerve conduction studies
As our standard procedure, we performed sural NCS using both surface and near-nerve technique. The protocol included more extensive examination of motor and sensory nerves in upper and lower extremities, which were not included in this report, to document the neuropathy.
As patients often had a NCS months ahead of the referral for small fibre evaluation, we repeated the recordings with surface electrodes and added sural NCS with near-nerve electrodes.
We recorded SNAP from the sural nerve at the lateral malleolus in a bipolar configuration (Ambu Blue Sensor, NF10a) evoking an antidromic responses 13 cm proximal to the recording electrode.
Orthodromic near-nerve recordings were made through purpose made subdermal electrodes 13 cm proximal to the lateral malleolus. Referential subdermal electrodes were placed 3–4 cm lateral and perpendicular to the nerve. At both positions, we documented the placement close to the nerve by a threshold below 1 mA direct current.
We recorded potentials (20 Hz-10kHz) during standard clinical visits using a Dantec Keypoint (Natus Medical Inc.) platform with potentials averaged from at least 50 responses. In all measurements, we controlled the temperature of the skin at both recording and stimulation sites using a thermode coupled heating lamp, securing a temperature above 34°C.
As the SNAP amplitudes were not immediately comparable, we calculated z-scores using unpublished Danish age-corrected and sex-corrected normative values for the surface technique (86 healthy individuals, unpublished data) and published data for the near-nerve technique (372 healthy individuals).7 16
Quantitative sensory testing
We further recorded warm and cold detection limits (WDT, CDT) from the dorsum of the foot (Medoc TSA-II Neurosensory Analyzer, Israel) according to the German Research Network for Neuropathic Pain17 and vibration perception threshold (VPT) (Somedic Vibrameter, Sweden) from the first metacarpal bone,18 both using the method of limits and reported as z-scores.
Statistical analysis
We tested all numerical data using a Shapiro-Wilkinson test and we did not find them significantly different from a normal distribution. The absolute SNAP amplitudes were log10-transformed.
We compared z-scores of the sural SNAP using the Bland-Altman Plot.19 20 Defining a normal sural SNAP amplitude to have a z-score of −2 or higher, we compared the frequency distribution of abnormal findings using the two techniques using a McNemar’s χ2 test with continuity correction.
We analysed the correlations of sural SNAP z-scores to Z-scores of QST thresholds using Pearson’s product-moment correlation.
To establish an SNAP amplitude discriminative threshold, we performed a receiver operated curve (ROC) analysis of the absolute SNAP amplitudes using QST z-scores at or above 2 and performed both an area-under-the-curve (AUC) analysis and an analysis of the optimal discriminative value of the amplitude, weighing sensitivity and specificity equally.
Results
We investigated 53 patients (23 male/30 female), with a mean age of 61.9 (range 18–79; SD 11.1) who had all examinations performed on the same day.
Comparisons of z-scores
Patients with probable painful neuropathy had a mean sural SNAP amplitude z-score of −1.0 (range −5.0–2.8; SD 1.9) and 15 patients (28.3%) had z-scores ≤ −2 using surface electrodes. Using the near-nerve technique, we found a mean sural SNAP z-score of −2.5 (range −8.8 to −0.1; SD 1.7) and 30 (56.6%) patients had a z-scores ≤ −2.
The SNAP amplitudes (figure 1) were correlated but not equal on a scatterplot and they had a lack of agreement with a numeric mean difference (near-nerve minus surface) of −1.49 (95% CI −1.87 to −1.12) with a statistical significant bias for the surface technique to give the z-value closest to zero.
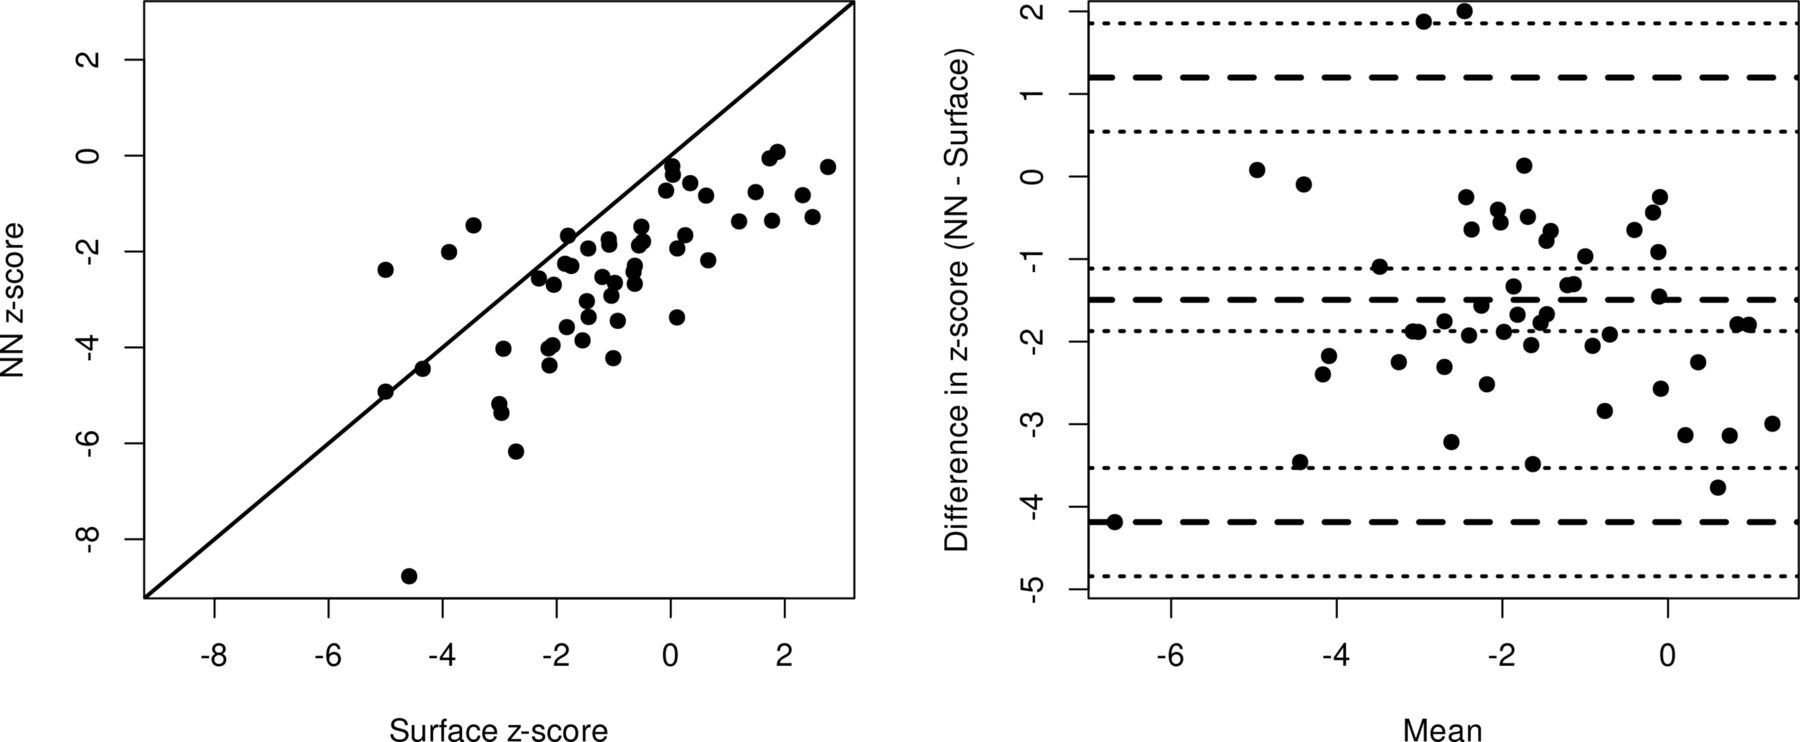
Scatterplot and Bland-Altman plot of sural SNAP amplitude z-scores using either surface or near-nerve (NN) subdermal recording. In the scatter plot (left), note the parallel displacement of z-values from the red x=y line. In the Bland-Altman plot (right), the middle dashed line marks the mean difference. The two other dashed lines mark the limits of agreement. The dotted lines show CIs for the corresponding mean and limits of agreement lines. Note the bias towards larger SNAP z-scores using the surface technique regardless of the mean z-score. The mean difference is −1.49 (95% CI −1.87 to −1.12). SNAP, sural nerve action potentials.
From the Bland-Altman Plot this bias is not dependent on the mean score and is thus not merely a sign of differences in sensitivity towards the largest or smallest of responses (statistical homoscedasticity), which suggested a uniform bias across amplitudes. The limits of agreement (upper limit 1.20; 95% CI 0.54 to 1.86; lower limit −4.19; 95% CI −4.84 to −3.53) supports the notion, that the two methods do not represent a common measurement of the sural SNAP amplitudes.
Comparing the classification as abnormal or normal (z ≤ −2), 36 patients (14 abnormal/abnormal, 22 normal/normal) had a concurring classification using the two techniques. One patient had an abnormal surface amplitude and a normal near-nerve amplitude and 16 patients, who had a normal surface amplitudes, were found having abnormality using the near-nerve technique. On a group level the classification using the two techniques were significantly different (McNemar’s χ2 test, p<0.001).
In this cohort, we were thus able to meet the criteria of a definite diagnosis of painful neuropathy in 28.3% and 56.6%, respectively, using surface and near-nerve electrodes, while the remaining patients needed further diagnostic efforts to meet a definite diagnosis. Further, we noted, that, when comparing SNAP amplitude measurements with values collected from normal subjects examined with either of the two methods used, we found them placed significantly different.
Correlation with sensory thresholds
We found a high mean z-score for CDT (1.88; range −2.32 to 3.95; SD 1.28), WDT (1.46; range −0.45 to 2.96; SD 0.83) and VPT (1.90; range −1.08 to 4.85; SD 1.44), reflecting a slight hypoesthesia. We found abnormal sensory thresholds (z-scores±2) suggesting hypoesthesia towards cold in 28 (52.8%), heat in 15 (28.3%) and vibration in 22 (41.5%) and we found hyperesthesia in one (1.9%) towards cold, while none had hyperesthesia towards heat or vibration. In 12 (22.6%) patients, we found no sensory abnormalities on QST despite the inclusion criteria of sensory abnormalities on clinical examination.
Using near-nerve technique, sural SNAP amplitude z-scores did not correlate with CDT (Pearson’s product-moment correlation r=−0.14; 95% CI −0.39 to 0.14; p=0.34) but significantly with both WDT (r=−0.32; 95% CI −0.54 to −0.05; p=0.02) and vibration thresholds (r=−0.32; 95% CI −0.54 to −0.05; p=0.02). Using surface technique, sural SNAP amplitude z-scores did not correlate with either CDT (Pearson’s product-momentum correlation r=0.01; 95% CI −0.26 to 0.28; p=0.93) or vibration thresholds (r=−0.22; 95% CI −0.46 to 0.05; p=0.11) but it correlated significantly with WDT (r=−0.28; 95% CI −0.51 to −0.01; p=0.04) (figure 2).
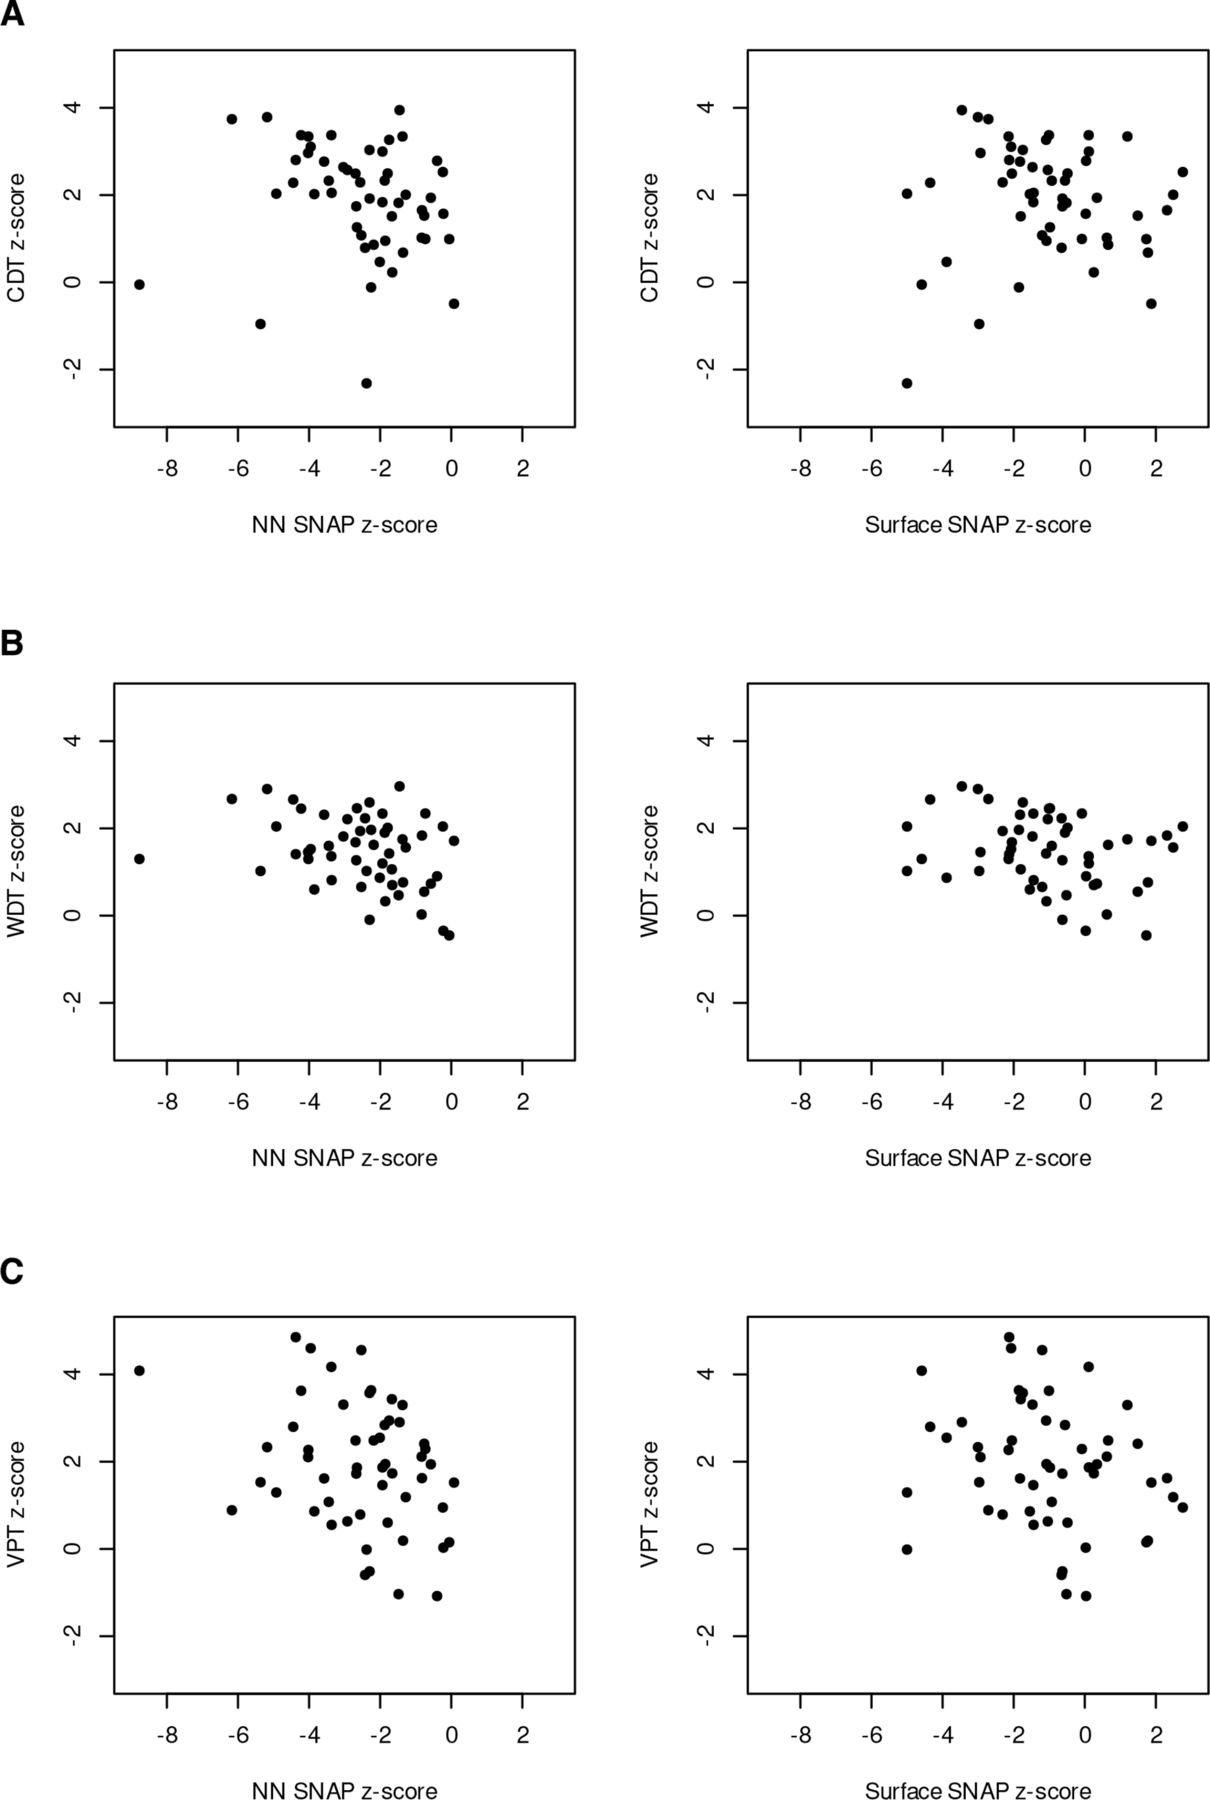
Correlation analysis between sensory thresholds. (A) Cold detection thresholds (CDT), (B) warm detection threshold (WDT), (C) vibration perception threshold (VPT)) and sural sensory nerve action potential amplitude z-scores using either near-nerve (NN) or surface (surface) nerve conduction technique. SNAP, sural nerve action potentials.
Since we included the patients based on primarily painful clinical symptoms and clinical findings, we found the prevalent sensory QST abnormalities reassuring. On the other hand, we did find inconsistent correlations between QST results and SNAP amplitude z-scores.
Although we did find correlation between near-nerve SNAP amplitudes and vibration, we did not find the patients classified accordingly. We found concordant classification in 31 patients (58.5%; 16/30 abnormal (56.3%); 15/23 normal (51.7%)) using near-nerve recording and in 34 patients (64.2%; 10/15 abnormal (66.7%); 24/38 normal (63.2%)) using surface electrodes.
Sensory thresholds used as a clinical case definition
To validate the lower limits of normal values for SNAP amplitudes, derived from our prior studies of normal individuals, we then evaluated the absolute sural SNAP amplitudes according to the QST results from the patients. We established a case definition of neuropathy in each patient using QST results (z-scores ≥2) and used ROC analysis to predict at what absolute SNAP amplitude value, the patient gained abnormal sensory function (figure 3).

Receiver operating curve (ROC) analysis of the discriminative power of sensory threshold results to determine the near-nerve (A) and surface (B) SNAP amplitude. The area under the curve (AUC) summarises the ROC curve just by taking the area between the curve and the x-axis. The point on the curve closest to the true positive rate of 1 and false positive rate of 0. This cut point is ‘optimal’ in the sense that it weighs both sensitivity and specificity equally. CDT, cold detection limit; SNAP, sural nerve action potentials; VIB, vibration perception threshold; WDT, warm detection limit.
Near-nerve sensory NCS predicted the presence of an abnormal QST for CDT, WDT and VPT (z-score ≥2) with an ROC AUC of 75.8%, 60.1% and 62.9%, respectively, while surface NCS predicted CDT, WDT and VPT with an ROC AUC of 70.0%, 61.1% and 67.4%, respectively.
Near-nerve SNAP amplitudes below 6.5 µV, 6.9 µV and 7.7 µV were optimal in predicting the presence of abnormal CDT, WDT and VPT, respectively, while the similar values using the surface technique were 5.9µV, 4.3µV and 4.3µV, respectively.
The lower 95% limits of SNAP amplitudes in the reference dataset for the typical healthy individual aged 64.1 years is 7.5 µV with near-nerve technique and 3.1 µV with surface technique.
Concluding from the ROC analysis, both sensory nerve conduction techniques were moderately successful in predicting the presence of abnormal thermal and vibratory thresholds, but with slightly different levels of SNAP amplitude for the optimal discriminative power.
Using near-nerve technique, we found the optimal discriminative SNAP amplitude value to predict large fibre involvement (VPT) to match the value established in healthy individuals in separate studies. The optimal value using surface electrodes were higher than what we established in healthy individuals in separate studies, suggesting that this method of recording did not perform as well. Interestingly, we found almost the same results using temperature QST as the case definition, although NCS and temperature thresholds examine different nerve fibres.
Discussion
In this study, we describe a clinically significant difference between two different NCS techniques in patients with painful neuropathy.
NCS techniques
In our laboratory, we established both methods using state-of-the-art description of normal ranges from a substantial number of healthy individuals spanning the different age groups. We consider both methods valid with reduction in SNAP amplitudes reflecting the degree of nerve fibre loss.
The laboratory validated the near-nerve technique against the total number of sural nerve fibres from micrographs using biopsies from patients with different degrees of neuropathy6 and found the electrically evoked responses equally sensitive compared with distal tactile stimuli.5 We generally find this technique superior to the surface technique at both ends of the normal range and equivalent in between, supported by data on sensitivity of the two techniques14 15 in patients with large fibre neuropathy.
In experienced hands, the two procedures have similar discomfort to the patient. Using the near-nerve technique, the placement of the two active electrodes takes a few minutes and the subsequent recording of the SNAP using supramaximal stimulation does not include painful pressure on the skin from surface stimulators and does not include percutaneous current with activation of pain fibres. Beyond being able to record from even a few remaining nerve fibres in severe neuropathy, the procedure enables a reliable determination of SNAP amplitudes in patients with crural oedema or obesity, thereby reducing the risk of falsely abnormal results.
Painful neuropathy
Prompting this study was unprecedented discrepancies found examining patients with probable painful neuropathy while validating the transferal of normative data.
In our study, changing from surface to subdermal electrodes increased the prevalence of large fibre dysfunction from 28.3% to 54.7%. This study defines this as a systematic bias across all signal sizes rather than merely a sign of sensitivity enabling recording of the smallest signals.
We hypothesise this bias as being caused by uncontrolled changes in the current pathway across the skin only affecting the surface recording.
Trophic skin changes due to neuropathy could induce this bias by reducing the distance from the nerve to the recording electrode or by a reduction in skin resistance due to dermal atrophy. Indeed, Bittel et al reported reduced volumes of subcutaneous adipose tissue in patient with diabetic neuropathy compared with controls with type 2 diabetes without neuropathy.21 Although literature builds up concerning the decreased electrochemical conductance to alternating or direct current in peripheral neuropathy,22 little is known about the impact on currents from the more complex SNAP at the recording site or from the impact of skin capacitance on the stimulus current.
Another bias could arise from the difference in conduction path. The ortodromic technique excites the nerve at a more distal site, which might not enable impulse generation in the impaired axons. This should have the opposite resulting bias, though.
Neuropathy classification
The clinical importance of this finding primarily rests in the diagnostic path for the patient with possible painful neuropathy. If NCS documents a large fibre abnormality, only thermal QST will be needed to document a mixed neuropathy with small fibre involvement in concordance with both the research classification of distal symmetrical neuropathy2 and NEUPsig criteria.9 With a bias towards normal findings using surface electrodes, more patients will need additional studies to establish a definite SNF diagnosis using Consensus Criteria.10–13 The clinical importance of this could differ across geography. If a neurology service performs NCS but not small fibre diagnosis with skin biopsy, a more sensitive NCS would give the diagnosis definite painful neuropathy by adding only QST for temperature. If the service had a full diagnostic workup, there would still be a reduction in cost to perform the IENFD processing in fewer patients. Presently, you do not need to meet the consensus criteria of SFN to make a definite diagnosis of a patient with painful neuropathy.
We found SNAP amplitudes to be correlated to the thresholds of both small and large fibres, although thin diameter fibres are not supposed to affect the recording,8 suggesting a common underlying pathology. Likewise, in the ROC analysis, we found the optimal discriminative SNAP amplitude to be the comparable when analysing both small fibre (CDT, WDT) and large fibre (VPT) sensory thresholds in this group of early neuropathy. This finding supports the view that neuropathy affects both small and large fibres in parallel without preferential small fibre involvement early on and questions SFN as a separate clinical entity. If a substantial number of our patients had early pure small fibre loss, we would find little difference of vibration abnormality, but we found abnormal vibration z-scores in 41.5% and abnormalities in 22 of the 41 patients (53.7%), who had abnormal sensory function on QST. The discriminative value of SNAP amplitude to predict an abnormal vibration z-score would also be lower than for temperature z-scores. We found no difference in the predictive value between WDT and VPT with surface technique but found a higher value for CDT suggesting that cold fibre functions were affected earlier than both heat and vibration sensitive fibres. Using near-nerve electrodes, SNAP amplitudes were even predicting vibration sense abnormalities at a higher value, suggesting earlier involvement. To be confident in that interpretation, we would like a confirmative study in a larger cohort with more clinical information on neuropathy symptom duration.
Reference values
Any clinical entity is defined by anatomical or clinical diagnostic measures. Additional diagnostic measures as the NCS need to be validated in comparison to that case definition. Transferal into another patient group will demand a repeat validation.
In the case of distal symmetric sensorimotor neuropathy, the case definition is purely clinical and the NCS techniques used were validated against the clinical presentation and the pseudoclinical measures of vibration thresholds. In the case of near-nerve recording additionally validation was made using anatomical case definitions.
When diagnosing painful neuropathy, another clinical entity, the case definition is still clinical. To validate NCS in this context, it is imperative not to rely entirely on small fibre measures and we did this by including vibration thresholds. The relative high number of patients with discordant classification using NCS and vibration thresholds, suggests that either test could not stand alone in revealing large fibre involvement in patients with painful neuropathy.
A coherence between the SNAP amplitude data using different NCS techniques, would allow us to trust the transferability of the normative values of both techniques into this patient group, but with a significant bias in SNAP amplitudes, they failed this test.
We are at present not able to conclude, that either test is preferable in diagnosing large fibre involvement, since the bias could be a result of both statistical bias inherent to but different between the two methods and a biological bias differentially affecting the methods (ie, trophic skin changes or fat tissue redistribution).
Our study of sensory NCS in patients with possible painful neuropathy has several strengths. We used a predefined diagnostic protocol on a large cohort of patient fulfilling the clinical definition of possible painful neuropathy.
A further strength is the systematic use of QST in this patient group. We detected large fibre involvement through vibration thresholds as well as small fibre involvement using temperature thresholds. Using those measures, we were able show, that in our cohort both NCS techniques were actually reflecting a clinical mixed neuropathy.
The primary weakness of the study was the lack of control groups including normal subject and patients with clinical large fibre neuropathy without pain symptoms. A future study including those groups could determine, if the bias found was due to a statistical bias or a biological bias in the patients with probable painful neuropathy. Collecting a reference group for clinical practice using both techniques would also help laboratories to select either method more confidently, based on the clinical need of the individual patient.
On the same issue, additional small-fibre tests as IENFD, would improve the ability to determine the impact on how this finding affects the SFN diagnosis in painful neuropathy. As the paper focuses on large fibre function this weakness does not affect the conclusion, though.
Data availability statement
Data are available on reasonable request.
Ethics statements
Patient consent for publication
Ethics approval
The Regional Ethics Committee approved the prospective collection of data from all procedures (H-2-2009-114) and the Local Data Protection Committee approved the retrospective data analysis (RH-2015-291).
Acknowledgments
We would like to thank Professor Christian Krarup for fruitful discussions in completing this work and Professor Frank Eriksson for the statistical advice.
References
Footnotes
Contributors Both authors contributed to the planning, data collection, analysis and manuscript preparation. MB is guarantor of the overall content.
Funding The authors have not declared a specific grant for this research from any funding agency in the public, commercial or not-for-profit sectors.
Competing interests No, there are no competing interests.
Provenance and peer review Not commissioned; externally peer reviewed.