Article Text

Abstract
Background The AT(N) classification was proposed for categorising individuals according to biomarkers. However, AT(N) profiles may vary depending on the markers chosen and the target population.
Methods We stratified 177 individuals who participated in the Japanese Alzheimer’s Disease Neuroimaging Initiative by AT(N) classification according to cerebrospinal fluid (CSF) biomarkers. We compared the frequency of AT(N) profiles between the classification using total tau and neurofilament light chain (NfL) as N markers (AT(N)tau and AT(N)NfL). Baseline characteristics, and longitudinal biological and clinical changes were examined between AT(N) profiles.
Results We found that 9% of cognitively unimpaired subjects, 49% of subjects with mild cognitive impairment, and 61% of patients with Alzheimer’s disease (AD) dementia had the biological AD profile (ie, A+T+) in the cohort. The frequency of AT(N) profiles substantially differed between the AT(N)tau and AT(N)NfL classifications. When we used t-tau as the N marker (AT(N)tau), those who had T− were more frequently assigned to (N)−, whereas those who had T+were more frequently assigned to (N)+ than when we used NfL as the N marker (AT(N)NfL). During a follow-up, the AD continuum group progressed clinically and biologically compared with the normal biomarker group in both the AT(N)tau and AT(N)NfL classifications. More frequent conversion to dementia was observed in the non-AD pathological change group in the AT(N)tau classification, but not in the AT(N)NfL classification.
Conclusions AT(N)tau and AT(N)NfL in CSF may capture different aspects of neurodegeneration and provide a different prognostic value. The AT(N) classification aids in understanding the AD continuum biology in various populations.
- ALZHEIMER'S DISEASE
- AMYLOID
- BIOCHEMISTRY
- CSF
Data availability statement
Data are available on reasonable request.
This is an open access article distributed in accordance with the Creative Commons Attribution Non Commercial (CC BY-NC 4.0) license, which permits others to distribute, remix, adapt, build upon this work non-commercially, and license their derivative works on different terms, provided the original work is properly cited, appropriate credit is given, any changes made indicated, and the use is non-commercial. See: http://creativecommons.org/licenses/by-nc/4.0/.
Statistics from Altmetric.com
WHAT IS ALREADY KNOWN ON THIS TOPIC
Previous studies showed the usefulness of the AT(N) classification, which biologically defines Alzheimer’s disease (AD) using biomarkers in, Caucasians. The prevalence of the AT(N) classification may differ depending on the selected markers and the target population. Investigations comparing different N markers (total tau vs neurofilament light, NfL) for the AT(N) classification are limited.
WHAT THIS STUDY ADDS
Our research using Japanese Alzheimer’s Disease Neuroimaging Initiative samples supported the usefulness of the ATN classification for predicting clinical and biological progressions. The frequencies of AT(N) profiles and conversion to dementia were different between two N markers (total tau and NfL). Our results suggest that the total tau and NfL in cerebrospinal fluid may capture different aspects of neurodegeneration and provide a distinct prognostic value.
HOW THIS STUDY MIGHT AFFECT RESEARCH, PRACTICE OR POLICY
The AT(N) classification aids in understanding the AD continuum biology and non-AD pathological changes in various populations. It should be noted that different biomarkers have distinct effects on clinical parameters and disease progression.
Introduction
As the population ages, the number of patients with dementia is expected to increase worldwide including in Asia.1 Alzheimer’s disease (AD) is pathologically characterised by β-amyloid (Aβ) deposition and fibrillar phosphorylated tau accumulation.2 Biofluid and molecular neuroimaging biomarkers have been explored to capture key aspects of the neuropathological changes of AD.
A research framework biologically defines AD by using biomarkers that reflect the brain pathology in vivo independent of clinical symptoms.3 In the framework, each individual is classified into one of eight categories by dichotomous determination according to the AT(N) system, where the cerebrospinal fluid (CSF) biomarkers of Aβ deposition (A), fibrillar tau (T) and neurodegeneration or neuronal injury (N) are defined by the Aβ42 or Aβ42/40 ratio, phosphorylated tau (p-tau) and total tau (t-tau), respectively.3 Through this research framework, AD has been conceptualised as a continuum covering asymptomatic, mild cognitive impairment (MCI) and dementia stages. The prevalence of the AT(N) classification has been investigated mostly among Caucasians, although a few studies have been reported for other ethnic groups.4–6 Studies on Asian populations did not address the longitudinal clinical and biological changes among AT(N) profiles.5 6 Because the prognostic value of AT(N) profiles may vary depending on the target population, the research framework should be further investigated in various populations including Asians.
Another issue of the AT(N) system is with regard to a biofluid N marker. Currently, CSF t-tau is assigned to the N maker. Since the research framework was advocated, evidence of CSF neurofilament light chain (NfL) as an N marker have been accumulated.7 8 NfL and t-tau in CSF are not always well correlated, suggesting that these markers may reflect different aspects in neurodegeneration.9–11
Using CSF samples collected by Japanese Alzheimer’s Disease Neuroimaging Initiative (J-ADNI),12 this study aimed to clarify (1) the characteristics of CSF biomarkers in a J-ADNI cohort, (2) the frequencies of AT(N) profiles by comparing two different N markers (t-tau and NfL), and (3) the clinical and biological characterisations according to AT(N) profiles at both baseline and follow-up.
Methods
Participants
J-ADNI was initiated to discover the fluid and imaging biomarkers of AD using a harmonised protocol with ADNI.12 13 Briefly, volunteer participants aged between 60 and 84 years were recruited from 38 clinical sites in Japan. Cognitively unimpaired (CU) subjects, subjects with MCI, and patients with AD dementia (ADD) were enrolled into J-ADNI using criteria consistent with those of ADNI.13 Their clinical and neuropsychological data were obtained from the National Bioscience Database Center (https://humandbs.biosciencedbc.jp/en/hum0043-v1).
Out of 715 volunteers assessed for eligibility, 537 met the criteria and were enrolled. Out of 537 participants recruited in J-ADNI (CU, 154; MCI, 234; ADD, 149), 4 withdrew their consent. Of the 533 remaining participants, 194 (CU, 53; MCI, 86; ADD, 55) underwent lumbar puncture. The incidence of postdural puncture headache was 2.6%, and that of severe postdural puncture headache that required hospitalisation was 0.7%. All these 194 participants were analysed using AD core biomarkers including Aβ42, tau phosphorylated at threonine 181 (p-tau181), and t-tau. Due to sample availability, CSF NfL was measured in 177 participants (CU, 46; MCI, 82; ADD, 49). At 12 months, longitudinal changes in CSF biomarkers classified by AT(N) profiles were analysed in 126 participants (CU, 38; MCI, 56; ADD, 32) (online supplemental figure 1).
Supplemental material
Lumbar puncture and biochemical analysis
CSF was collected by lumbar puncture, transferred into polypropylene tubes followed by freezing and shipped to the J-ADNI Biomarker Core at Niigata University. CSF was aliquoted at a volume of 0.5 mL and stored at ‒80℃ until the assay. The CSF concentrations of Aβ42, p-tau181, and t-tau were examined using on AlzBio3 kit (Fujirebio, Ghent, Belgium), and that of NfL was measured using R-PLEX Human Neurofilament L Antibody Set (Meso Scale Discovery, Rockville, MD). All analyses were conducted in duplicate by experienced laboratory personnel blinded to the clinical diagnosis. The intra-assay and interassay coefficients of variation were <20% for all assays. The laboratory at Niigata University participates in the Alzheimer’s Association external quality control programme for CSF biomarkers.14
We previously used CSF Aβ42<333 pg/mL as the cut-off value for Aβ positivity.12 15 Thereafter, we have established a protocol for AD core biomarker measurements unified with the ADNI Biomarker Core (PI: Leslie M. Shaw, PhD). We used this unified protocol for remeasuring the CSF biomarkers. Subsequently, we conducted the area under the receiver operating characteristic curve analysis (PET Aβ negative (PET Aβ−, n=47) vs positive (PET Aβ+, n=53); CU with PET Aβ− (n=31) vs ADD with PET Aβ+ (n=22); CU (n=53) vs ADD (n=56)), and calculated the optimal cut-off values according to Youden’s index (online supplemental figures 2 and 3). Furthermore, we used Gaussian mixture models (GMMs) for calculating the cut-off value of CSF biomarkers (n=194), excluding NfL, which was unsuitable for GMMs because of the unimodal distribution (online supplemental figure 2).
PET image acquisition and clinical evaluation
All PET images underwent the J-ADNI PET quality control process as previously described.16 Cognitive performance was assessed using the Mini-Mental State Examination (MMSE), Alzheimer’s Disease Assessment Scale-Cognitive Subscale (ADAS-Cog), and the sum of boxes of the Clinical Dementia Rating (CDR-SB). Instrumental activities of daily living were assessed using the Functional Assessment Questionnaire (FAQ). In this study, when the CDR changed from 0 or 0.5 to ≧1 during a follow-up, the patient was considered to have progressed to dementia.
Statistical analysis
Data were analysed statistically using GraphPad Prism (V.8.2.0; GraphPad Software, La Jolla, California, USA) and the software R. For continuous variables, we used the Mann-Whitney U test for comparing two groups and the Kruskal-Wallis test for comparing multiple groups, followed by Dunn’s multiple-comparison test. For categorical variables, groups were compared using the χ2 test. The correlation between two data sets was assessed using Spearman’s rank-correlation coefficient. For the longitudinal analyses of changes in CSF biomarker, we compared slopes with zero by linear regression model analyses. The covariates included age, sex and education years. For the longitudinal analyses of clinical score changes, independent variables including combined AT(N) groups, follow-up time, age, sex, education years and the interactions between AT(N) groups and follow-up time were examined using the linear mixed model (LMM). Additionally, random slopes and random intercepts of the follow-up time within subjects served as the random factors for the longitudinal analyses of the clinical scores. P values were adjusted by false discovery rate to avoid type I error.
Results
Demographics of participants
At baseline, CSF samples were collected from 194 participants with CU (n=53, 27.3%), MCI (n=86, 44.3%) and ADD (n=55, 28.4%). Of the 194 participants, 100 (51.5%) were analysed by Aβ PET imaging, and half of them (53.0%) were Aβ-positive (online supplemental table 1). Due to sample availability, 177 (91.2%) of the 194 participants had CSF NfL measurements at the baseline, and 126 (64.9%) underwent follow-up lumbar puncture after 12 months.
Cross-sectional analysis of CSF biomarkers
The correlations between baseline characteristics and CSF biomarkers were analysed. Both the MCI and ADD groups showed significantly lower CSF Aβ42 level and higher p-tau181, t-tau and NfL levels than the CU group. Additionally, the CSF Aβ42 level was significantly lower in the ADD group than in the MCI group (online supplemental figure 4A). In all groups, age showed a significant positive correlation with p-tau181, t-tau, and NfL level except for Aβ42 (online supplemental figure 4B). Years of education also positively correlated with CSF Aβ42 level but not with p-tau181, t-tau, nor NfL level (online supplemental figure 4C). In addition, males showed significantly higher CSF NfL levels than females (online supplemental figure 4D). Both APOE ε4 heterozygous and homozygous carriers showed significantly lower CSF Aβ42 levels and higher p-tau181, t-tau and NfL levels than non-carriers (online supplemental figure 4E).
Next, correlations among CSF biomarkers were analysed. We found that Aβ42 level moderately negatively correlated with p-tau181, t-tau, and NfL levels. As expected, p-tau181 and t-tau levels were highly correlated (r=0.7923, p<0.0001). NfL level showed moderately positive correlations with p-tau181 (r=0.2487, p=0.0008) and t-tau levels (r=0.4907, p<0.0001) (online supplemental figure 5).
AT(N) classification at baseline
We used CSF Aβ42 as the A marker, p-tau181 as the T marker, and t-tau or NfL as the N marker. AT(N)tau and AT(N)NfL were defined using t-tau and NfL as the N marker, respectively. We classified the participants into eight AT(N) categories.
The cut-off value was compared by different methods. When comparing clinical status (CU vs ADD) with PET status (PET Aβ− vs PET Aβ+), the cut-off values were lower for Aβ42 and higher for p-tau181, t-tau and NfL (table 1). When the PET Aβ status and clinical status were combined (CU with PET Aβ− vs ADD with PET Aβ+), the cut-off values were intermediate between the PET Aβ status and the clinical status only, and close to GMM-calculated cut-off values (table 1). Thus, hereafter, the cut-off values used in this study were CSF Aβ42<359.6 pg/mL (A+), p-tau181 >30.6 pg/mL (T+), t-tau >105.3 pg/mL (N+) and NfL >2650 pg/mL (N+).
Cut-off values of AT(N) biomarkers based on different models
We showed the demographic and clinical variables among the eight AT(N) biomarker categories in the AT(N)tau classification (table 2, upper half). The proportion of CU decreased from 33% to 60% in the A− groups to 0%–19% in the A+ groups, whereas that of ADD increased from 0% to 25% in the A− groups to 40%–50% in the A+ groups.
Baseline characteristics of 8 AT(N) profile groups
Next, we determined the characteristics of the eight AT(N) profiles in the AT(N)NfL classification (table 2, lower half). The proportion of CU decreased from 31% to 69% in the A− groups to 0%–35% in the A+groups, whereas that of ADD increased from 0% in the A− groups to 25%–62% in the A+ groups.
To determine the frequency of biological AD, we classified 177 subjects by using the AT system comprising CSF Aβ42 and p-tau181. The subjects were then classified into A−T− (n=55, 31.1%), A−T+ (n=7, 4.0%), A+T− (n=41, 23.2%) and A+T+ (n=74, 41.8%) (figure 1). A−T− accounted for 69.9% in CU, whereas A+T− and A+T+ accounted for 68.3% in MCI. In ADD, A+T− was 36.7% and A+T+ was 61.2%.
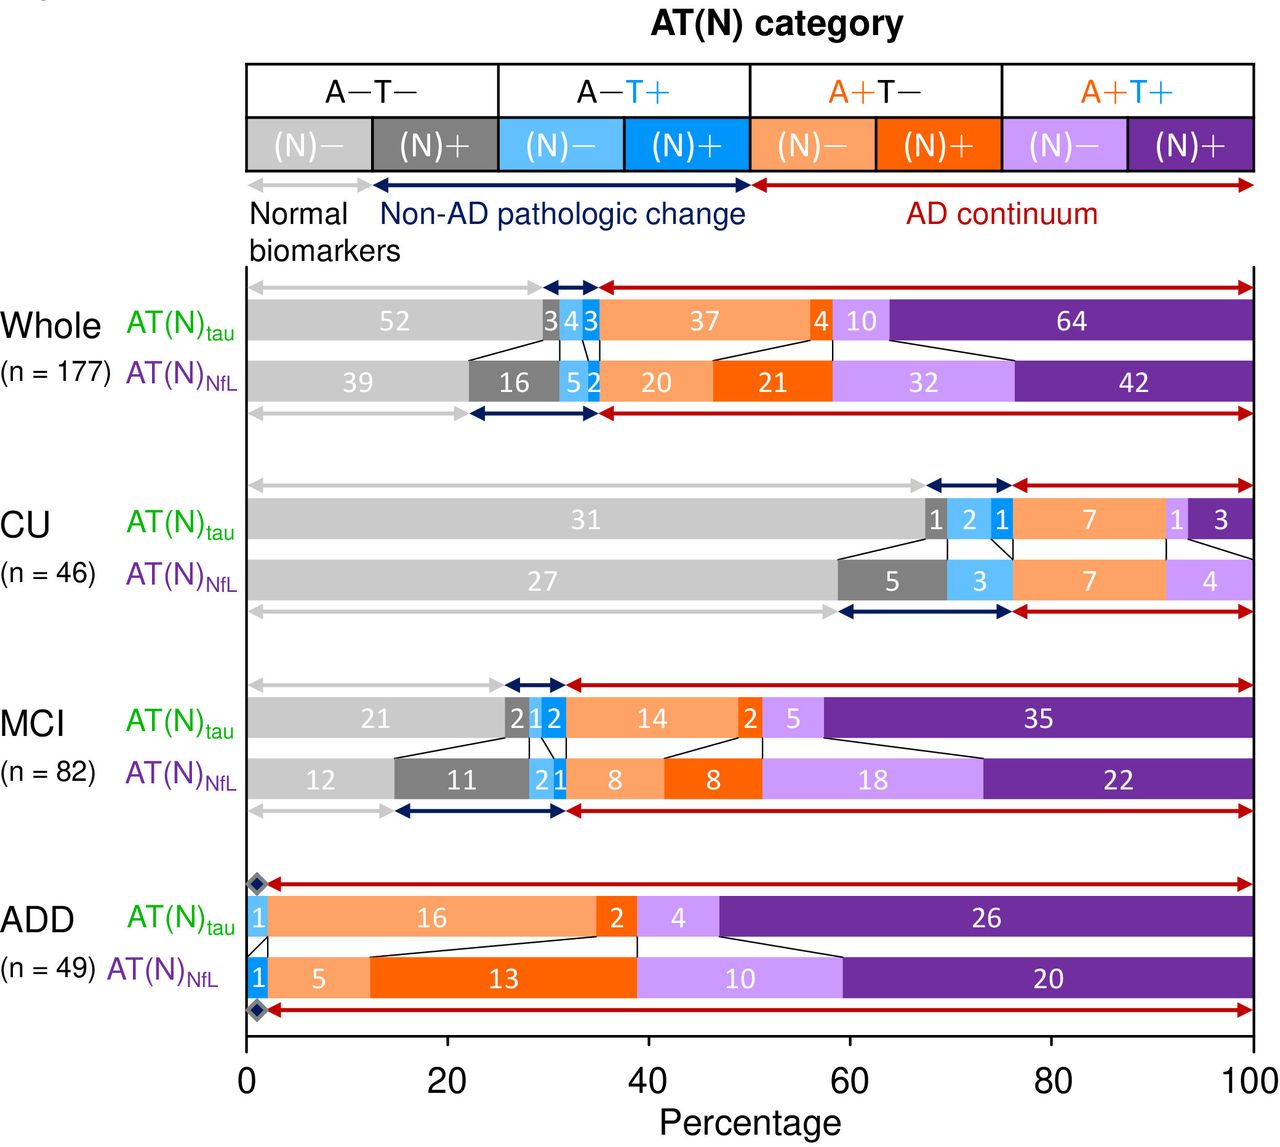
Frequency of the AT(N) profiles in the Japanese ADNI cohort. Each AT(N) category is shown by different colours in the top panel: A−T−(N)− (light grey), A−T−(N)+ (grey), A−T+(N)− (light blue), A−T+(N)+ (blue), A+T−(N)− (light orange), A+T−(N)+ (orange), A+T+(N)− (lavender), and A+T+(N)+ (violet). The upper bar (AT(N)tau) shows the frequency of AT(N) categories based on CSF Aβ42, p-tau181, and total tau used as the A, T and N markers, respectively. The lower bar (AT(N)NfL) shows the frequency of AT(N) categories based on CSF Aβ42, p-tau181, and NfL used as the A, T and N markers, respectively. Numbers on bars indicate the number of participants classified to each AT(N) profile. Arrows indicate three groups, namely, the normal biomarker (light grey), non-AD pathological change (dark blue), and AD continuum (dark red). ADD, Alzheimer’s disease dementia; CSF, cerebrospinal fluid; CU, cognitively unimpaired, MCI, mild cognitive impairment; NfL, neurofilament light chain.
AT(N) classification: comparison between t-tau and NfL
We compared the frequencies of AT(N) categories between AT(N)tau and AT(N)NfL. In AT(N)tau, the most common was A+T+(N)+ (n=64, 36.2%), followed by A−T−(N)− (n=52, 29.4%) and A+T−(N)− (n=37, 20.9%) (figure 1). Considering the high correlation between t-tau and p-tau181 (online supplemental figure 5), CSF t-tau may not be a fully independent marker of neurodegeneration in the AD continuum.
In AT(N)NfL, the frequencies of the A−T−(N)−, A+T−(N)−, and A+T+(N)+ categories decreased to 22.0% (n=39), 11.3% (n=20), and 23.7% (n=42) compared with AT(N)tau, respectively (figure 1). Thus, the subsets of participants in the A−T− and A+T− categories with neurodegeneration (A−T−(N)NfL + and A+T−(N)NfL+) were classified into (N)− in AT(N)tau (figure 1). Supporting this finding, the subsets of participants in the A−T−(N)tau− and A+T−(N)tau− categories showed elevated NfL levels (online supplemental figure 6). In contrast, a subset of participants in the A+T+ category with undetectable neurodegeneration (A+T+(N)NfL−) showed elevated t-tau levels (online supplemental figure 6); thus, they were classified into (N)+ in AT(N)tau (figure 1).
Longitudinal changes of AT(N) profiles
In 126 participants with follow-up CSF examination at 12 months, changes in the levels of most of the biomarkers were not statistically significant. After 12 months, the p-tau181 level significantly elevated in the A−T−(N)− category by both AT(N) classifications, in A+T−(N)− by AT(N)tau classification, and in A+T−(N)+ by AT(N)NfL classification (online supplemental table 3, online supplemental figure 7).
We assessed the longitudinal changes of the AT(N) profiles at 12 months. The AD continuum biologically progressed, and the progression rate differed between AT(N) profiles at the baseline (figure 2). In the AT(N)tau classification, the progression rate was 2.1% (1 of 47) among A− groups. A+T−(N)− progressed to A+T+(N)− and A+T+(N)+ in five and two participants, respectively. All four participants with A+T−(N)+ progressed to A+T+(N)+. Thus, the progression rate of these A+T− to A+T+ was 42.3%. One participant with A+T+(N)− progressed to A+T+(N)+ (14.3%) (figure 2A).
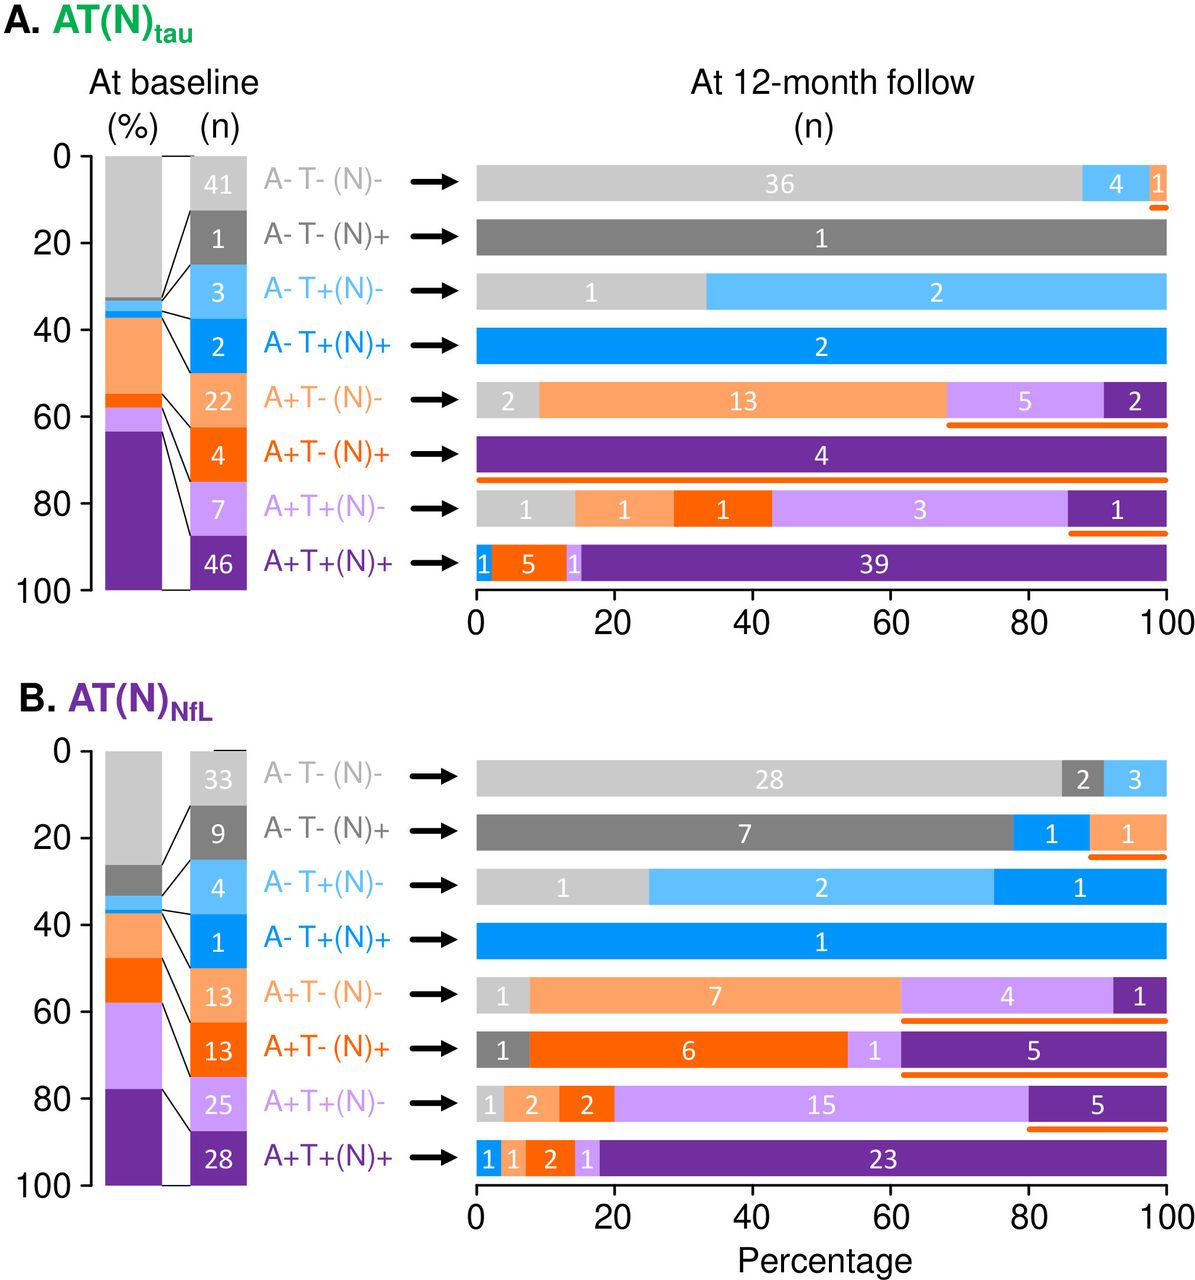
Longitudinal changes of AT(N) profile in AT(N)tau (A) and AT(N)Nfl classifications (B) during the 12-month follow-up. The vertical bar on the left shows the frequency and number of subjects classified to each AT(N) profile at the baseline. The horizontal bars on the right show the AT(N) profiles at 12 months. The orange line under the horizontal bar indicates participants who showed biological progression within the AD continuum (ie, A−T−(N)−/+ to A+T−(N)−/+, A+T−(N))−/+ to A+T+(N)−/+, and A+T+(N)− to A+T+(N)+). AD, Alzheimer’s disease.
In the AT(N)NfL classification, the progression rate was 2.1% (1 of 47) in the A− groups. The progression rate from A+T− to A+T+ was 38.5%. Five A+T+(N)− participants progressed to A+T+(N)+ (20.0%) (figure 2B). Hence, participants with the A− profile rarely progressed to A+ within 12 months. Conversely, approximately 40% of participants with A+T− progressed to A+T+ and 10%–20% of participants with A+T+(N)− progressed to A+T+(N)+ within 12 months in either the AT(N)tau or AT(N)NfL classification (figure 2). Notably, longitudinal changes of AT(N) profiles were different in A+T−(N)+ and A+T+(N)− categories between the AT(N)tau and AT(N)NfL classifications (figure 2).
Longitudinal change of cognitive functions
Owing to the small sample size of some of the AT(N) categories, we categorised eight AT(N) profiles into three groups, namely, the normal biomarker (A−T−(N)−), AD continuum (A+T−/+(N)−/+) and non-AD pathological change (A−T−/+(N)−/+) groups. At the baseline, the AD continuum group showed significantly lower MMSE and higher ADAS-Cog, CDR-SB and FAQ scores than the normal biomarker group (figure 3, online supplemental table 2). In the AT(N)Nfl classification, the AD continuum group showed significantly lower MMSE and higher ADAS-cog, CDR-SB and FAQ scores than the non-AD pathological change group. No such significant differences were observed in the AT(N)tau classification (figure 3).

Clinical and cognitive scores at baseline among three groups. Upper panels show the clinical and cognitive scores of each group in the AT(N)tau classification. Lower panels show the clinical and cognitive scores of each group in the AT(N)NfL classification. *P<0.001 compared with normal biomarker group, †p<0.05 compared with normal biomarker group, ‡p<0.01 compared with non-AD pathological change group. AD, Alzheimer’s disease; ADAS-Cog, Alzheimer’s Disease Assessment Scale−Cognitive Subscale; CDR-SB, sum of boxes of the Clinical Dementia Rating; FAQ, Functional Assessment Questionnaire; MMSE, Mini-Mental State Examination.
We conducted LMM analysis to evaluate cognitive decline assessed by four clinical measures (MMSE, ADAS-Cog13, CDR-SB and FAQ) during the follow-up period up to 36 months. All the clinical measures in the AD continuum and non-AD pathological change groups declined faster than in the normal biomarker group, except for the CDR-SB of the non-AD pathological change group in AT(N)NfL classification (table 3, figure 4).

Longitudinal changes of clinical and cognitive scores in three groups. We used linear mixed models to evaluate clinical and cognitive performances over time in three groups in the AT(N)tau classification (left panels) and AT(N)NfL classification (right panel). Asterisk indicates a significant progression compared with normal biomarker group (ie, A–T–(N)–). Dagger indicates a significant progression compared with non-AD pathological change group. AD, Alzheimer’s disease; ADAS-Cog, Alzheimer’s Disease Assessment Scale-Cognitive Subscale; CDR-SB, sum of boxes of the Clinical Dementia Rating; FAQ, Functional Assessment Questionnaire; MMSE, Mini-Mental State Examination.
Longitudinal changes of clinical scores in three groups
Clinical conversion into dementia
Of 139 participants, 57 (41.0%) clinically converted into dementia during 36 months of follow-up. The subjects who converted to dementia exhibited significantly higher levels of t-tau and NfL at the baseline than the non-converters (t-tau, p<0.001; NfL, p=0.0033).
Cox proportional hazard analysis showed that the AD continuum and non-AD pathological change groups converted into dementia more frequently than the normal biomarker group in the AT(N)tau classification (figure 5A). In the AT(N)NfL classification, only the AD continuum group converted into dementia more frequently than the normal biomarker group (figure 5B). Discordance of prognosis in the non-AD pathological change group between the AT(N)tau and AT(N)NfL classifications suggests that CSF t-tau elevation without Aβ42 reduction (A−(N)tau+) may be related to a higher rate of conversion to dementia; conversely, no such relationship was found in the case of CSF NfL elevation without Aβ42 reduction.

Conversion to dementia in three groups classified using AT(N)tau (A) and AT(N)NfL classification (B). Survival curves of participants without dementia at the baseline (CDR 0, n=46; CDR 0.5, n=116) illustrate the time of progression to CDR>0.5. Asterisk indicates a significantly frequent conversion to dementia compared with the normal biomarker group as a reference. AD, Alzheimer’s disease; CDR, Clinical Dementia Rating.
Discussion
In this paper, we show the results of CSF biomarker analysis among J-ADNI participants from the preclinical stage to dementia who were longitudinally followed up for 3 years. We found that 8.7%, 48.8% and 61.2% of the CU, MCI, and ADD groups had the biological AD profile (ie, A+T+), respectively (table 2, figure 1). By comparing the N marker between t-tau and NfL, we found that the AT(N) profiles showed different frequencies. When we used t-tau as the N marker (AT(N)tau), those who had T− were more frequently assigned to (N)−, whereas those who had T+ were more frequently assigned to (N)+ compared with the case of using NfL as the N marker (AT(N)NfL) (table 2, figure 1). This finding may be explained by the high correlation between t-tau and p-tau181. Participants with A− rarely changed to A+, but approximately 40% of the participants with A+T− changed to A+T+ in 12 months (figure 2). Finally, four A+ groups, that is, the AD continuum group declined clinically and cognitively compared with the normal biomarker group. Notably, when we used AT(N)tau classification, the non-AD pathological change group showed a significantly higher conversion rate than the normal biomarker group (figure 5).
Since the NIA-AA Research Framework was published, the prevalence of biological AD according to CSF biomarker analysis has been reported (online supplemental table 4).8 17–22 In the US-ADNI study, 21%, 84% and 82% of the CU, MCI (progressed to dementia later) and ADD groups showed the A+T+ profile, respectively.19 A previous study with five cohorts showed biological AD in 11% of participants with CU.22 In the BioFINDER study, where CSF NfL was used as the N marker, 17% of the CU and 39%–86% of MCI and mild ADD groups had biological AD.8 Compared with these western cohorts, our Japanese cohort had slightly lower prevalence rates of biological AD, with 9%, 49% and 61% in the CU, MCI, and ADD groups, respectively. This lower prevalence rate is consistent with a recent study from South Korea, where the prevalence rate of biological AD are 2%, 30% and 57% in the CU, MCI and ADD groups, respectively.6 These findings suggest that the lower prevalence rate of biological AD in east Asia could result from a slightly lower T+ prevalence rate (CU, 15‒18%; MCI, 39‒52%; ADD, 59‒63%) compared with the western cohorts (CU, 23%–38%; MCI; ADD, 59–88%). This difference may be explained by whether the J-ADNI and Korean study recruited participants with an earlier AD stage, or the A+T+ prevalence rate is truly low in east Asian populations.
We demonstrated the different characteristics between t-tau and NfL used as N markers. Results showed that t-tau moderately correlated with NfL (r=0.49; online supplemental figure 5), but highly correlated with p-tau181 (r=0.79), consistent with previous reports.23–25 In the AT(N)tau classification, participants with T− showed the (N)− profile more frequently, whereas those with T+ showed the (N)+ profile more frequently (table 2, figure 1). CSF NfL has been reported to reflect neurodegeneration more closely than t-tau in the AD continuum.8 10 Recently, it has been reported that Aβ deposition in the brain facilitates the secretion of tau fragments in CSF.26 Thus, the mechanism of tau elevation in CSF in the AD continuum may differ from the mechanism(s) underlying other types of neuronal injury with the non-AD pathology. It should be noted that each of the fluid and imaging biomarkers have a different prognostic value.
Considering that both fluid and imaging biomarkers are continuous values along the course of the AD continuum, AT(N) classification defined by dichotomising the cut-off value should be cautiously interpreted. In our comparison, the cut-off value used for distinguishing PET Aβ+ individuals from PET Aβ− individuals was substantially higher than that used for distinguishing individuals with ADD from those with CU (378.7 pg/mL vs 288.6 pg/mL, table 1). Similarly, the cut-off values for the T and N markers that discriminate the PET Aβ status were lower than those that discriminate the clinical status. Considering that approximately 20% of ADD cases could be clinically misdiagnosed as dementia with the non-AD pathology and 30% of elderly people without cognitive impairment have the AD pathology,27 28 determination of the cut-off value using clinically diagnosed samples should be conducted with caution. An unbiased method has been reported to overcome this problem, because it does not depend on the clinical information of the samples.29 Notably, there is discrepancy in the cut-off value of CSF Aβ42 between ADNI and our study (J-ADNI).12 13 The discrepancy may be explained by the differences in the methods used to determine the cut-off value, background characteristics and ethnic background.
Our study revealed that CSF biomarkers were useful in predicting longitudinal progression in the J-ADNI cohort, as reported in western cohorts (table 3, figure 5).8 22 Conversion to dementia was most frequent in participants in the AD continuum group. Biologically, A− participants rarely converted into A+; however, approximately 40% of A+T− participants converted into A+T+ within 12 months (figure 2). In the US-ADNI study, CSF p-tau has a faster annual rate of change than CSF Aβ42, consistent with our results.30 Taken together, A+ participants have a high risk of clinical and biological progression.
This study has several limitations. First, some AT(N) profiles had a small sample size, possibly yielding an insufficient statistical power for detecting significant differences between groups. Second, the follow-up period of 12 months for CSF assessment was relatively short. Thus, the longitudinal changes of biomarkers shown in previous reports could not be detected in our study.31–33 Third, participants of J-ADNI were clinically evaluated and not diagnosed by autopsy. For example, the aetiological cause in subjects with the A−T− (N)+ profile is likely to be small vessel diseases and non-tau dementia; however, this assumption needs to be confirmed by further study. Finally, to better understand the optimal N marker, further studies are required to confirm the correlation between biofluid markers and neuroimaging markers such as volumetric MRI.
Conclusion
In this study, we determined the frequency of the AT(N) profiles in the J-ADNI cohort using two different N markers in CSF. The biological AD profile (A+T+) was found in 9%, 49%, and 61% of participants with CU, MCI and ADD, respectively. The AT(N) profile showed different frequencies between AT(N)tau and AT(N)NfL. Irrespective of the classification, participants with the AD continuum group progressed clinically and biologically. CSF NfL may be more reflective N-marker than t-tau in AD continuum. The AT(N) classification would aid in understanding the AD continuum biology in various populations.
Data availability statement
Data are available on reasonable request.
Ethics statements
Patient consent for publication
Ethics approval
This study involves human participants and was approved by Niigata University Ethics CommitteeReference number: H25-636. The Ethics Committee of Niigata University approved this study (2018-0409). Participants gave informed consent to participate in the study before taking part.
Acknowledgments
We thank participants of J-ADNI and their partners for their contribution to the study. We thank Mr. Kohei Sato, Ms. Yuko Kudo, Yuki Ogawa, Reina Sato and Eri Furukawa for their technical assistance. We are grateful to all the participants of J-ADNI and their caregivers. J-ADNI was supported by the following grants: Translational Research Promotion Project from the New Energy and Industrial Technology Development Organization of Japan; Research on Dementia, Health Labor Sciences Research Grant; Life Science Database Integration Project of Japan Science and Technology Agency; Research Association of Biotechnology (contributed by Astellas Pharma Inc., Bristol-Myers Squibb, Daiichi-Sankyo, Eisai, Eli Lilly and Company, Merck-Banyu, Mitsubishi Tanabe Pharma, Pfizer, Shionogi & Co, Sumitomo Dainippon, and Takeda Pharmaceutical Company), Japan, and a grant from an anonymous Foundation.
References
Supplementary materials
Supplementary Data
This web only file has been produced by the BMJ Publishing Group from an electronic file supplied by the author(s) and has not been edited for content.
Footnotes
KK and MK contributed equally.
Collaborators Japanese Alzheimer’s Disease Neuroimaging InitiativeFull list of individual names: Takeshi Iwatsubo, Takeshi Ikeuchi, Ryozo Kuwano, Takashi Asada, Hiroyuki Arai, Morihiro Sugishita, Hiroshi Matsuda, Kengo Ito, Michio Senda, Kenji Ishii, Noriko Sato, Hajime Sato, Shun Shimohama, Masaki Saitoh, Rika Yamauchi, Takashi Hayashi, Seiju Kobayashi, Norihito Nakano, Junichiro Kanazawa, Takeshi Ando, Chiyoko Takanami, Masato Hareyama, Masamitsu Hatakenaka, Eriko Tsukamoto, Shinji Ochi, Mikio Shoji, Etsuro Matsubara, Takeshi Kawarabayashi, Yasuhito Wakasaya, Takashi Nakata, Naoko Nakahata, Shuichi Ono, Yoshihiro Takai, Satoshi Takahashi, Hisashi Yonezawa, Junko Takahashi, Masako Kudoh, Makoto Sasaki, Yutaka Matsumura, Yohsuke Hirata, Tsuyoshi Metoki, Susumu Hayakawa, Yuichi Sato, Masayuki Takeda, Toshiaki Sasaki, Koichiro Sera, Kazunori Terasaki, Yoshihiro Saitoh, Shoko Goto, Kuniko Ueno, Hiromi Sakashita, Kuniko Watanabe, Ken Nagata, Yuichi Sato, Tetsuya Maeda, Yasushi Kondoh, Takashi Yamazaki, Daiki Takano, Mio Miyata, Hiromi Komatsu, Mayumi Watanabe, Tomomi Sinoda, Rena Muraoka, Kayoko Kikuchi, Hitomi Ito, Aki Sato, Toshibumi Kinoshita, Hideyo Toyoshima, Kaoru Sato, Shigeki Sugawara, Isao Ito, Fumiko Kumagai, Katsutoshi Furukawa, Masaaki Waragai, Naoki Tomita, Nobuyuki Okamura, Mari Ootsuki, Katsumi Sugawara, Satomi Sugawara, Shunji Mugikura, Atsushi Umetsu, Takanori Murata, Tatsuo Nagasaka, Yukitsuka Kudo, Manabu Tashiro, Shoichi Watanuki, Masatoyo Nishizawa, Takayoshi Tokutake, Saeri Ishikawa, Emiko Kishida, Nozomi Sato, Mieko Hagiwara, Kumi Yamanaka, Takeyuki Watanabe, Taeko Takasugi, Shoichi Inagawa, Kenichi Naito, Masanori Awaji, Tsutomu Kanazawa, Kouiti Okamoto, Masaki Ikeda, Tsuneo Yamazaki, Yuiti Tasiro, Syunn Nagamine, Shiori Katsuyama, Sathiko Kurose, Sayuri Fukushima, Etsuko Koya, Makoto Amanuma, Noboru Oriuti, Kouiti Ujita, Kazuhiro Kishi, Kazuhisa Tuda, Katsuyoshi Mizukami, Tetsuaki Arai, Etsuko Nakajima, Katsumi Miyamoto, Kousaku Saotome, Tomoya Kobayashi, Saori Itoya, Jun Ookubo, Toshiya Akatsu, Yoshiko Anzai, Junya Ikegaki, Yuuichi Katou, Kaori Kimura, Ryou Kuchii, Hajime Saitou, Kazuya Shinoda, Satoka Someya, Hiroko Taguchi, Kazuya Tashiro, Masaya Tanaka, Tatsuya Nemoto, Ryou Wakabayashi, Daisuke Watanabe, Harumasa Takano, Tetsuya Suhara, Hitoshi Shinoto, Hitoshi Shimada, Makoto Higuchi, Takaaki Mori, Hiroshi Ito, Takayuki Obata, Yoshiko Fukushima, Kazuko Suzuki, Izumi Izumida, Katsuyuki Tanimoto, Takahiro Shiraishi, Hitoshi Shinotoh, Hitoshi Shimada, Junko Shiba, Hiroaki Yano, Miki Satake, Aimi Nakui, Yae Ebihara, Tomomi Hasegawa, Yasumasa Yoshiyama, Mami Kato, Yuki Ogata, Hiroyuki Fujikawa, Nobuo Araki, Yoshihiko Nakazato, Takahiro Sasaki, Tomokazu Shimadu, Kimiko Yoshimaru, HM, Etsuko Imabayashi, Asako Yasuda, Etuko Yamamoto, Natsumi Nakamata, Noriko Miyauchi, Keiko Ozawa, Rieko Hashimoto, Taishi Unezawa, Takafumi Ichikawa, Hiroki Hayashi, Masakazu Yamagishi, Tunemichi Mihara, Masaya Hirano, Shinichi Watanabe, Junichiro Fukuhara, Hajime Matsudo, Nobuyuki Saito, Atsushi Iwata, Hisatomo Kowa, Toshihiro Hayashi, Ryoko Ihara, Toji Miyagawa, Mizuho Yoshida, Yuri Koide, Eriko Samura, Kurumi Fujii, Kaori Watanabe, Nagae Orihara, Toshimitsu Momose, Akira Kunimatsu, Harushi Mori, Miwako Takahashi, Takuya Arai, Yoshiki Kojima, Masami Goto, Takeo Sarashina, Syuichi Uzuki, Seiji Katou, Yoshiharu Sekine, Yukihiro Takauchi, Chiine Kagami, Kazutomi Kanemaru, Shigeo Murayama, Yasushi Nishina, Maria Sakaibara, Yumiko Okazaki, Rieko Okada, Maki Obata, Yuko Iwata, Mizuho Minami, Yasuko Hanabusa, Hanae Shingyouji, Kyoko Tottori, Aya Tokumaru, Makoto Ichinose, Kazuya Kume, Syunsuke Kahashi, Kunimasa Arima, Tadashi Tukamoto, Shin Tanaka, Yuko Nagahusa, Masuhiro Sakata, Mitsutoshi Okazaki, Yuko Saito, Maki Yamada, Tiine Kodama, Maki Obata, Tomoko Takeuchi, Keiichiro Ozawa, Yuko Iwata, Hanae Shingyouji, Yasuko Hanabusa, Yoshiko Kawaji, Kyouko Tottori, Noriko Sato, Yasuhiro Nakata, Satoshi Sawada, Makoto Mimatsu, Daisuke Nakkamura, Takeshi Tamaru, Shunichirou Horiuchi, Heii Arai, Tsuneyoshi Ota, Aiko Kodaka, Yuko Tagata, Tomoko Nakada, Eizo Iseki, Kiyoshi Sato, Hiroshige Fujishiro, Norio Murayama, Masaru Suzuki, Satoshi Kimura, Masanobu Takahashi, Haruo Hanyu, Hirofumi Sakurai, Takahiko Umahara, Hidekazu Kanetaka, Kaori Arashino, Mikako Murakami, Ai Kito, Seiko Miyagi, Kaori Doi, Kazuyoshi Sasaki, Mineo Yamazaki, Akiko Ishiwata, Yasushi Arai, Akane Nogami, Sumiko Fukuda, Kyouko Tottori, Mizuho Minami, Yuko Iwata, Koichi Kozaki, Yukiko Yamada, Sayaka Kimura, Ayako Machida, Kuninori Kobayashi, Hidehiro Mizusawa, Nobuo Sanjo, Mutsufusa Watanabe, Takuya Ohkubo, Hiromi Utashiro, Yukiko Matsumoto, Kumiko Hagiya, Yoshiko Miyama, Takako Shinozaki, Haruko Hiraki, Hitoshi Shibuya, Isamu Ohashi, Akira Toriihara, Shinichi Ohtani, Toshifumi Matsui, Yu Hayasaka, Tomomi Toyama, Hideki Sakurai, Kumiko Sugiura, Hirofumi Taguchi, Shizuo Hatashita, Akari Imuta, Akiko Matsudo, Daichi Wakebe, Hideki Hayakawa, Mitsuhiro Ono, Takayoshi Ohara, Yukihiko Washimi, Yutaka Arahata, Akinori Takeda, Yoko Konagaya, Akiko Yamaoka, Masashi Tsujimoto, Hideyuki Hattori, Takashi Sakurai, Miura Hisayuki, Hidetoshi Endou, Syousuke Satake, Young Jae Hong, Katsunari Iwai, Kenji Yoshiyama, Masaki Suenaga, Sumiko Morita, Teruhiko Kachi, Kenji Toba, Rina Miura, Takiko Kawai, Ai Honda, KI, Takashi Kato, Ken Fujiwara, Rikio Katou, Mariko Koyama, Naohiko Fukaya, Akira Tsuji, Hitomi Shimizu, Hiroyuki Fujisawa, Tomoko Nakazawa, Satoshi Koyama, Takanori Sakata, Masahito Yamada, Mitsuhiro Yoshita, Miharu Samuraki, Kenjiro Ono, Moeko Shinohara, Yuki Soshi, Kozue Niwa, Chiaki Doumoto, Mariko Hata, Miyuki Matsushita, Mai Tsukiyama, Nozomi Takeda, Sachiko Yonezawa, Ichiro Matsunari, Osamu Matsui, Fumiaki Ueda, Yasuji Ryu, Masanobu Sakamoto, Yasuomi Ouchi, Madoka Chita, Yumiko Fujita, Rika Majima, Hiromi Tsubota, Umeo Shirasawa, Masashi Sugimori, Wataru Ariya, Yuuzou Hagiwara, Yasuo Tanizaki, Hidenao Fukuyama, Ryosuke Takahashi, Hajime Takechi, Chihiro Namiki, Kengo Uemura, Takeshi Kihara, Hiroshi Yamauchi, Shizuko Tanaka-Urayama, Emiko Maeda, Natsu Saito, Shiho Satomi, Konomi Kabata, Shin-Ichi Urayama, Tomohisa Okada, Koichi Ishizu, Shigeto Kawase, Satoshi Fukumoto, Masanori Nakagawa, Takahiko Tokuda, Masaki Kondo, Fumitoshi Niwa, Toshiki Mizuno, Yoko Oishi, Mariko Yamazaki, Daisuke Yamaguchi, Kyoko Ito, Yoku Asano, Chizuru Hamaguchi, Kei Yamada, Chio Okuyama, Kentaro Akazawa, Shigenori Matsushima, Takamasa Matsuo, Toshiaki Nakagawa, Takeshi Nii, Takuji Nishida, Kuniaki Kiuchi, Masami Fukusumi, Hideyuki Watanabe, Toshiaki Taoka, Akihiro Nogi, Masatoshi Takeda, Toshihisa Tanaka, Naoyuki Sato, Hiroaki Kazui, Kenji Yoshiyama, Takashi Kudo, Masayasu Okochi, Takashi Morihara, Shinji Tagami, Noriyuki Hayashi, Masahiko Takaya, Tamiki Wada, Mikiko Yokokoji, Hiromichi Sugiyama, Daisuke Yamamoto, Shuko Takeda, Keiko Nomura, Mutsumi Tomioka, Eiichi Uchida, Yoshiyuki Ikeda, Mineto Murakami, Takami Miki, Hiroyuki Shimada, Suzuka Ataka, Motokatsu Kanemoto, Jun Takeuchi, Akitoshi Takeda, Rie Azuma, Yuki Iwamoto, Naomi Tagawa, Junko Masao, Yuka Matsumoto, Yuko Kikukawa, Hisako Fujii, Junko Matsumura, Susumu Shiomi, Joji Kawabe, Yoshihiro Shimonishi, Yukio Miki, Mitsuji Higashida, Tomohiro Sahara, Takashi Yamanaga, Shinichi Sakamoto, Hiroyuki Tsushima, Kiyoshi Maeda, Yasuji Yamamoto, Toshio Kawamata, Kazuo Sakai, Haruhiko Oda, Takashi Sakurai, Taichi Akisaki, Mizuho Adachi, Masako Kuranaga, Sachi Takegawa, Yoshihiko Tahara, Seishi Terada, Takeshi Ishihara, Hajime Honda, Osamu Yokota, Yuki Kishimoto, Naoya Takeda, Nao Imai, Mayumi Yabe, Kentaro Ida, Daigo Anami, Seiji Inoue, Toshi Matsushita, Reiko Wada, Shinsuke Hiramatsu, Hiromi Tonbara, Reiko Yamamoto, Kenji Nakashima, Kenji Wada-Isoe, Saori Yamasaki, Eijiro Yamashita, Yu Nakamura, Ichiro Ishikawa, Sonoko Danjo, Tomomi Shinohara, Miyuki Ueno, Yuka Kashimoto, Yoshihiro Nishiyama, Yuka Yamamoto, Narihide Kimura, Kazuo Ogawa, Yasuhiro Sasakawa, Takashi Ishimori, Yukito Maeda, Tatsuo Yamada, Shinji Ouma, Aika Fukuhara-Kaneumi, Nami Sakamoto, Rie Nagao, Kengo Yoshimitsu, Yasuo Kuwabara, Ryuji Nakamuta, Minoru Tanaka, Manabu Ikeda, Mamoru Hashimoto, Keiichirou Kaneda, Yuusuke Yatabe, Kazuki Honda, Naoko Ichimi, Fumi Akatuka, Mariko Morinaga, Miyako Noda, Mika Kitajima, Toshinori Hirai, Shinya Shiraishi, Naoji Amano, Shinsuke Washizuka, Toru Takahashi, Shin Inuzuka, Tetsuya Hagiwara, Nobuhiro Sugiyama, Yatsuka Okada, Tomomi Ogihara, Takehiko Yasaki, Minori Kitayama, Tomonori Owa, Akiko Ryokawa, Rie Takeuchi, Satoe Goto, Keiko Yamauchi, Mie Ito, Tomoki Kaneko, Hitoshi Ueda, Shuichi Ikeda, Masaki Takao, Ban Mihara, Hirofumi Kubo, Akiko Takano, Gou Yasui, Masami Akuzawa, Kaori Yamaguchi, Toshinari Odawara, Megumi Shimamura, Mikiko Sugiyama, Atsushi Watanabe, Naomi Oota, Shigeo Takebayashi, Yoshigazu Hayakawa, Mitsuhiro Idegawa, Noriko Toya, Kazunari Ishii.
Contributors KK contributed to the concept of the study, analysis of the data and wrote the manuscript. MK contributed to the concept of the study, analysis of the data and wrote the manuscript. TT contributed to acquisition of the data and analysis of the data. KS contributed acquisition of the data. RI contributed to acquisition of the data. AI contributed to acquisition of the data. NH contributed to interpretation of the data. AM contributed to analysis of the data. RK contributed to the acquisition of the data. TIw contributed to the acquisition of the data. TIk contributed to the conception of the study, drafting the manuscript and critical revision of the manuscript and is responsible for the overall content as guarantor. J-ADNI contributed to acquisition of the data.TIk contributed to the conception of the study, drafting the manuscript and critical revision of the manuscript and is responsible for the overall content as guarantor.
Funding This study was supported by AMED under grant number JP22dm0207073, JP22dk0207057, 22dk0207059 and 22wm0525019.
Competing interests No, there are no competing interests.
Provenance and peer review Not commissioned; externally peer reviewed.
Supplemental material This content has been supplied by the author(s). It has not been vetted by BMJ Publishing Group Limited (BMJ) and may not have been peer-reviewed. Any opinions or recommendations discussed are solely those of the author(s) and are not endorsed by BMJ. BMJ disclaims all liability and responsibility arising from any reliance placed on the content. Where the content includes any translated material, BMJ does not warrant the accuracy and reliability of the translations (including but not limited to local regulations, clinical guidelines, terminology, drug names and drug dosages), and is not responsible for any error and/or omissions arising from translation and adaptation or otherwise.