Article Text

Abstract
Introduction The association between socioeconomic status (SES) and Parkinson’s disease (PD) has been investigated in few studies. To our knowledge, SES measurement based on wealth index and perceived SES in PD patients has not been investigated in any study. Also, the simultaneous measurement of objective and perceived SES and their association with PD has not been conducted yet. This study aimed to determine the association between various SES indicators and PD.
Methods This incident case–control study was conducted on 508 patients with PD and 1015 controls randomly selected from the general population in Iran in 2021–2022. A telephone interviewing method was used for data collection. The wealth index and educational level were used to measure objective SES. Perceived SES was also recorded. Multiple logistic regression was used to calculate the adjusted OR (AOR).
Results A significant association based on the wealth index was found, where the intermediate category had lower odds of developing PD than the deprived category (AOR 0.75 (95% CI 0.58 to 0.99)). The odds of PD was significantly higher in the people with academic education compared with illiterate and primary-level education (AOR 2.17 (95% CI 1.58 to 2.99). Additionally, the odds of PD were significantly lower in the intermediate (AOR 0.26 (95% CI 0.13 to 0.52)) and affluent (AOR 0.21 (95% CI 0.11 to 0.40)), compared with the deprived categories based on perceived SES. Similar results were obtained in the analysis by sex.
Conclusion This study demonstrated that lower wealth index, a lower perceived SES and academic education are associated with increased the odds of PD.
- PARKINSON'S DISEASE
Data availability statement
Data are available on reasonable request.
This is an open access article distributed in accordance with the Creative Commons Attribution Non Commercial (CC BY-NC 4.0) license, which permits others to distribute, remix, adapt, build upon this work non-commercially, and license their derivative works on different terms, provided the original work is properly cited, appropriate credit is given, any changes made indicated, and the use is non-commercial. See: http://creativecommons.org/licenses/by-nc/4.0/.
Statistics from Altmetric.com
WHAT IS ALREADY KNOWN ON THIS TOPIC
The association between socioeconomic status (SES) and PD is different in the studies that have been conducted so far. Some studies have reported a direct association while others have observed an inverse association. On the other hand, some studies have not observed any association.
WHAT THIS STUDY ADDS
Intermediate category compared with the deprived category had a lower chance of developing PD based on wealth index. Patients with PD had a lower self-reported or perceived SES than the general population. Illiteracy and primary education reduced the chance of PD.
HOW THIS STUDY MIGHT AFFECT RESEARCH, PRACTICE OR POLICY
By knowing that the lower SES is associated with a higher chance of PD, we can consider screening programmes in lower SES individuals who are at higher risk.
Introduction
The most prevalent neurodegenerative movement disorder, Parkinson’s disease (PD), is caused by the selective loss of dopamine-producing cells and the inappropriate accumulation of alpha-synuclein in Lewy bodies in the brain and spinal cord.1 2 The symptoms of tremors, muscle stiffness, bradykinesia/akinesia and posture instability are caused due to reduced dopamine levels in the basal ganglia.3 In industrialised countries, 0.3% of the general population and 1%–3% of people over 60 are affected by PD.3 Limited studies have been carried out in Iran to determine the prevalence and incidence of PD.4 5 Given that Iran is a low/middle-income country that is undergoing rapid demographic changes, national censuses have revealed the ageing trend of the Iranian population, which in turn hints towards the increasing PD trend in Iran.6 According to a study conducted in Tehran, the most populated city and capital of Iran, the standardised prevalence based on Tehran’s population ranged from 129 to 156 per 100 000 people in 2015,4 which was close to the prevalence in Europe and the Eastern Mediterranean region and higher than those in Eastern Asia and Africa.7–9
Numerous studies have revealed that PD is influenced by both genetic and environmental factors.2 3 A family history of PD, a history of head trauma, exposure to insecticides, anxiety or depression, and consuming dairy products have all shown a direct association with PD.10 11 In contrast, many studies have found an inverse association between physical activity, smoking, coffee and alcohol consumption with PD.10–12 Moreover, demographic characteristics, such as age, gender, ethnicity and socioeconomic status (SES), may be associated with PD.1 Age is the most significant known risk factor for PD; so PD has emerged as a serious public health concern in older societies.13 This concern is more severe in lo0w/middle-income countries due to a lack of preparation to face the high burden of chronic diseases such as PD.14
One of the factors related to various diseases is SES.15–17 SES is important since it has been known to affect the occurrence of certain diseases by affecting various environmental and social factors.18 Although the association between SES and certain chronic diseases has been studied,15–17 a few studies have investigated the association between SES and PD,18–20 and these studies have shown conflicting results. In a study conducted in Sweden using the type of occupation as a proxy of SES, it was found that individuals with lower SES had a lower risk of developing PD.18 This is while a study in Canada reported a higher risk of PD in people with lower SES.21 Several studies have also investigated the association between PD and educational level as a proxy of SES.19 22 23 Some of these studies have demonstrated an association between PD and educational level,19 23 while some others have not.22 No study has been conducted in the world that has measured different indicators of SES including objective and subjective aspects simultaneously to determine the association between SES and PD. Previous studies have concentrated on the association between objective SES and PD, while no study has considered the association between perceived SES and PD. Perceived SES refers to a perception of one’s social position in society compared with others, which may differ from the actual SES.24 25 Given the inconsistency in previous studies, it seemed necessary to conduct this study to determine the association between different aspects of SES and PD. To our knowledge, this is the first study that has examined the association between SES and PD in a low/middle-income country. Based on a large incidence-based case and control study in Iran, several SES variables including, perceived SES, educational level and wealth index were used to assess the potential association between SES and PD after controlling the confounding variables.
Materials and methods
Setting and participants
The present incidence-based case and control study was conducted between April 2021 and May 2022 in Tehran, the capital of Iran, which has the highest ethnic diversity. The source population included more than 1.8 million individuals above 50 years living in Tehran’s 22 districts.
Case selection
Cases were people from the source population who were diagnosed with PD during the study period. For the recruitment of cases, out of a total of six referral centres in Tehran, two centres including Hazrat-e-Rasool Hospital’s neurology clinic and Tehran’s northwest clinic were used.26 All incident cases were diagnosed by at least one neurologist using the Movement Disorder Society’s criteria.27 Out of a total of 543 new cases during the study period, 508 (response rate:93%) were included in the study.
Control selection
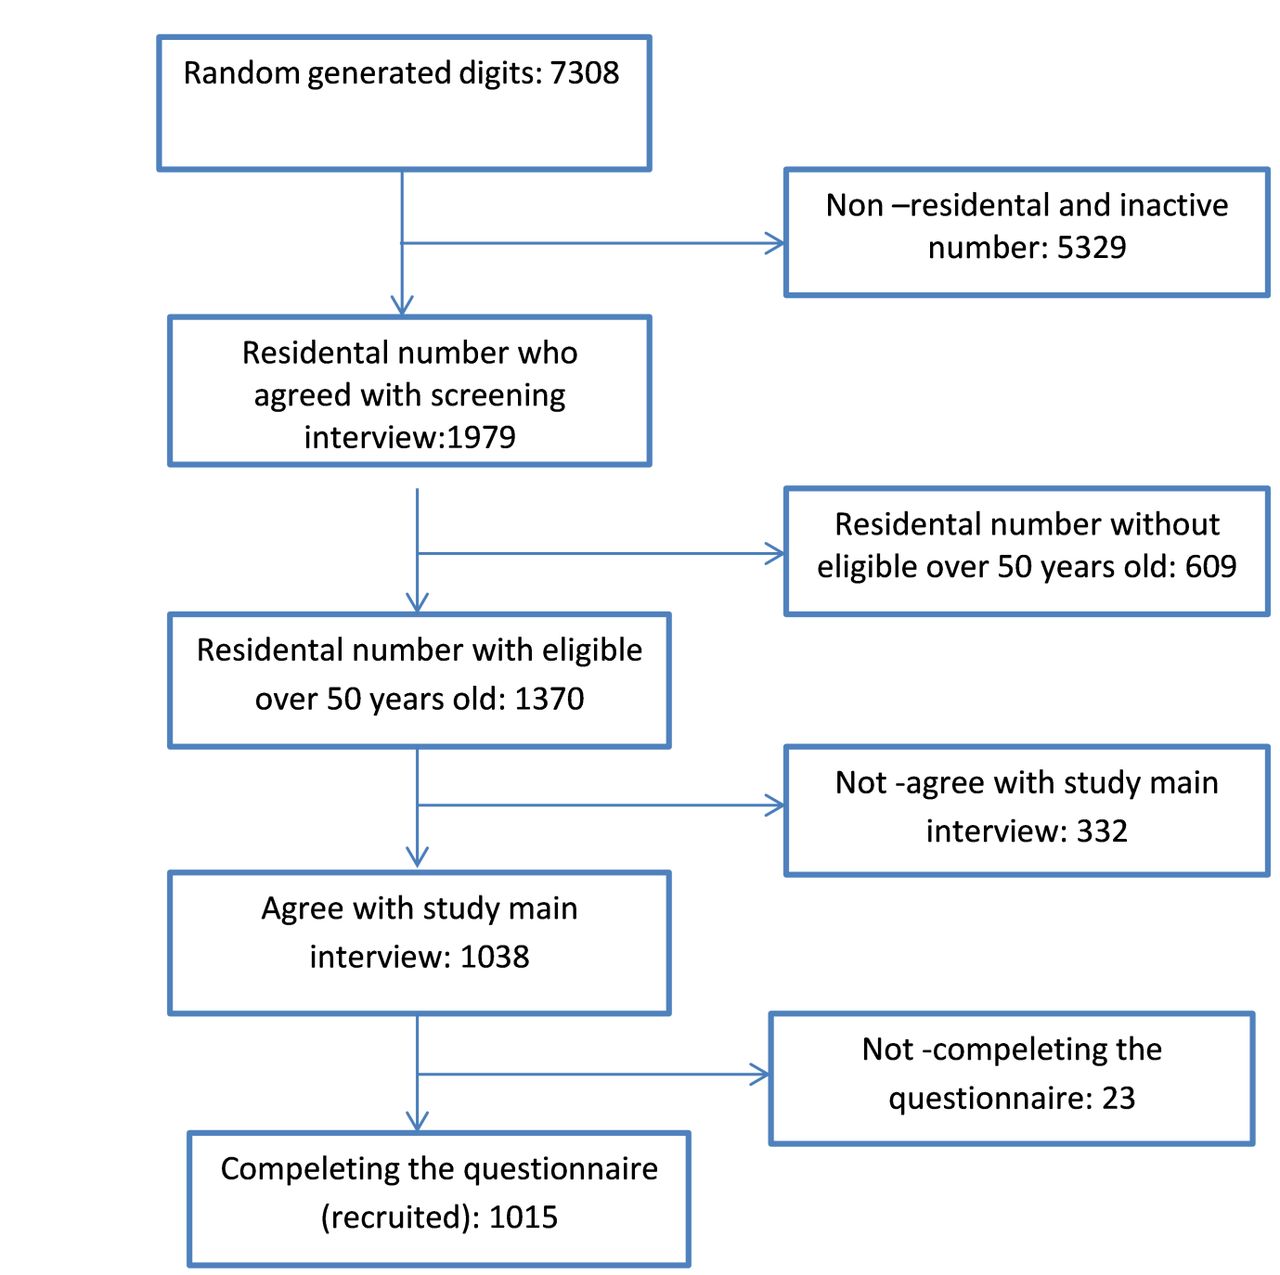
The study’s controls were individuals without PD residing in Tehran’s 22 districts at the time of the study. The clinical symptoms and signs of PD were explained at the beginning of the interview to reduce the probability of unknown cases being misclassified among the controls. Controls were selected proportionately to the population of Tehran’s 22 districts using the random digit dialling (RDD) technique based on the RDD standard protocol. Phone numbers were created by adding four random digits to the area codes of Tehran’s districts. At the time of the call, 5329 of these numbers were either non-residential or inactive. The remaining 1979 numbers were reduced by 609 since none of their family members met the eligibility criteria. A total of 1038 (response rate: 63.9%) of the 1370 eligible households agreed to participate in the interview; 23 were excluded due to incomplete interviews and 1015 completed questionnaires were included in the study (figure 1). The Kish method was used in this study to choose one participant from the eligible family members.28 The sampling date for controls and the diagnosis date for cases were considered as the index date.
Detailed flow chart of the control group’s recruitment, Tehran, 2021–2022.
Data collection protocol
Telephone interviews were conducted by eight trained interviewers, who were given the required instructions during three sessions to standardise the interviews and use the established data collection protocol. The study’s primary goals were fully explained to both the case and control groups at the beginning of each interview. The participants were requested to give all the aforementioned information before the index date for the cases and the sampling date for the controls.
Measurement
The outcome was PD status. The following SES variables and indicators were considered as exposure in this study:
Objective SES: The variables of wealth index and educational level were used to determine the participants’ objective SES. Participants were asked to report the schooling years they had completed and to determine the highest level of education they had achieved. The educational-level variable was divided into three levels including, illiterate and primary, secondary, and academic education.
To create the wealth index variable, information related to assets, including, having a personal computer/ laptop, air cooker, dishwasher, microwave oven/toaster/electric oven, smartphone, personal car, freezer, fryer, LED or LCD Television and rechargeable broom, were gathered. A binary measure for each asset variable was created: having the corresponding asset (coded 1) vs not having it (coded 0). The area of the house and the number of rooms per capita were also measured.
Perceived SES: The participants were asked to imagine a ladder with ten steps for measuring perceived SES. At the top of the ladder, there are the individuals with the most money, the highest education and the best jobs. At the bottom, there are individuals with the least money, the least education, the least respected jobs or no job.29 The participants were then asked to select the step that best reflected their SES in Tehran’s society. Earlier studies have demonstrated the validity and reliability of the mentioned scale for assessing perceived SES.30 31 The 1st, 2nd and 3rd steps were labelled as ‘deprived’, the 4th, 5th, 6th and 7th steps as ‘intermediate’, and the 8th, 9th and 10th steps as ‘affluent’.
Variables in the statistical analysis included sex, age (in years), marital status (single, married, single due to spouse’s death or divorce) and ethnicity which was defined based on the tongue spoken in the parents’ home (including Fars, Turk, Kurd, Lor, Mazani, and Gilak, Baluch, Turkmen, and Arab). The following three features were considered confounding factors: causal association with the outcome variable, association with the desired exposure and not being an intermediate variable.32
Statistical methods
Descriptive data were measured for both the case and control groups. Due to the non-normality of the ‘age’ and ‘schooling years’ variables, they were described using the median and IQR values. The crude OR was estimated using the univariable logistic regression model. The confounding variables were analysed using multiple logistic regression and the adjusted OR (AOR) was calculated. Stata V.13 was used to analyse the data.
The wealth index was also calculated using principal component analysis (PCA). In the PCA analysis, assets with the greatest variance between households were given the most weight. The analysis included 12 components. The first component explained 27% of the total variance for SES factors and represented the largest differences between families; thereby, it was sufficient to produce the wealth index.33 The wealth index was then divided into tertiles based on the first component. The bottom third was classified as ‘deprived’, the middle third as ‘intermediate’ and the top third as ‘affluent’.
Due to the importance of the sex variable, the analysis was performed by sex to see whether there are the association between PD and SES based on sex or not.
Patient and public involvement
Neither patients nor the public were involved in the design, conduct, report and dissemination plans of this research.
Results
The demographic characteristics of the study groups are shown in table 1. Men accounted for 64.96% of the case group and 49.06% of the control group participants. The median ages of the case and control groups were 62.00 and 60.00 years, respectively. The majority of the participants were aged between 50 and 60 years. The case group’s median schooling years was 1 year higher than that of the control group (11.00 vs 10.00). The proportion of Fars participants in the case group was 51.39%, compared with 76.15% in the control group. Table 1 includes additional demographic characteristics of the participants.
Characteristics of cases with PD and population-based controls, Tehran, 2021–2022
Table 2 indicates a significant association between the wealth index and PD, such that the odds of PD were significantly lower in the intermediate category compared with the deprived category (AOR 0.75 (95% CI 0.58 to 0.99)). Moreover, the unadjusted odds of PD of the affluent category were lower than that of the deprived category (OR 0.74 (95% CI 0.57 to 0.95)). Furthermore, a significant association was found between PD and educational level in the highest category, such that the odds of the disease among academically educated individuals (AOR 2.17 (95% CI 1.58 to 2.99)) was higher than that of the illiterate and primary educated people. The odds of PD were significantly lower in all perceived SES levels than those of the deprived ((AOR 0.46 (95% CI 0.31 to 0.69); AOR 0.26 (95% CI 0.17 to 0.41) for intermediate and affluent, respectively)).
Association between PD and the wealth index, educational level and perceived SES, Tehran, 2021–2022
Table 3 shows the participants’ SES variables by sex. The odds of PD were lower in the men’s intermediate category than that of the deprived category (AOR 0.70 (95% CI 0.50 to 0.99)), while the odds of the disease were lower in the affluent women compared with those of the deprived (AOR 0.49 (95% CI 0.32 to 0.76)). A significant association was found between the level of education and PD of both men and women, such that the odds of PD in academically educated people were higher than that of the illiterate and primary education level individuals (AOR 2.06 (95% CI 1.29 to 1.56), AOR 2.12 (95% CI 1.04 to 1.24) for men and women, respectively). Additionally, considering the perceived SES variable, the odds of PD were lower in all perceived SES categories compared with the deprived in both sexes (AOR 0.56 (95% CI 0.32 to 0.97) for the intermediate men; AOR 0.30 (95% CI 0.17 to 0.53) for the affluent men; AOR 0.38 (95% CI 0.21 to 0.68) for the intermediate women, and AOR 0.27 (95% CI 0.14 to 0.53) for the affluent women).
Association between PD and wealth index, educational level and perceived SES by sex, Tehran, 2021–2022
Discussion
This was a case–control study based on incident cases in Tehran. Several variables were used to measure SES. Their potential association with PD was determined after adjusting the confounding variables. The study’s findings revealed that based on the wealth index, the intermediate people had a lower chance of developing PD than the deprived. This association was seen in both sexes. However, affluent women had a lower chance of getting PD than the deprived women. Also, the odds of PD among individuals with intermediate and affluent perceived SES were lower than those of the deprived. In the analysis by sex, this association was confirmed in all categories for both men and women. But the results of the educational level variable were in contrast with the results of the wealth index and perceived SES. Hence, men and women with academic education had a higher chance of developing PD. Overall, the results of our study showed that people of the higher SES category, whether based on the wealth index or the perceived status, had a lower chance of developing PD.
Few studies have been conducted on the association between SES and PD in the world. None of these studies have applied the wealth index to measure SES.19–21 23 A population-based study in Canada showed an inverse association between SES and PD; that is, the incidence and prevalence of PD were significantly higher in the lower quintiles of urban areas. Their study used census data, and the SES categories were based on the average household income.21 The aforementioned study is in line with our study’s wealth index-based results. This inverse association between SES and PD was also observed in our study’s sex-based results for the affluent category women and intermediate category men.
In a study in Scotland, the objective SES of patients with PD was assessed using the Deprivation Category index. This index classifies people based on postal areas from one (least deprived) to seven (most deprived). There was no difference in the incidence of PD among various SES categories using this index.20 In another study conducted in Sweden, the Swedish Socioeconomic Index5 was used as an objective measure of SES to determine its association with PD. This index separates employers from employees and divides individuals into various social groups based on their jobs. According to the study’s results, SES was directly associated with the incidence of PD, so lower SES was associated with a lower incidence of the disease.18 Our study’s wealth index-based results contradict these findings, such that people with an intermediate level of wealth had a lower odds of developing PD than those who were deprived.
Another Swedish study that had used education as a surrogate for SES found that men with higher levels of education were at a higher risk of developing PD.19 Similarly, the results of our study also showed that academically educated individuals, both men and women, had significantly higher odds of developing PD. In general, sex does not seem to change the direction of association between PD and the SES variables.
In our study, a significant inverse association was found between perceived SES and PD. When compared with women, the magnitude of the association was slightly stronger in men. No other study on PD patients has evaluated perceived SES. When compared with individuals from the intermediate and affluent perceived SES categories, the higher chance of developing PD among the deprived can be biologically justified. The lack of dopamine in the brain has a direct effect on the development of Parkinson’s disease.34 On the other hand, due to this decrease in dopamine, positive feelings such as satisfaction or pleasure also decrease,35 so one’s perception of SES may be generally lower. A person’s perceived SES reveals a sense of social class identity, which can be influenced by his or her past, present status and prospects for the future.24 25 36 Perceived SES is measured by one multidimensional question that combines various SES elements, and a person may consider information and circumstances not included in the objective SES indicators when answering about his or her perceived SES status. Therefore, measuring perceived SES in health studies alongside objective SES can provide more comprehensive information about the status.25 37 Notably, there is no consensus on the best index to measure SES, and each SES index can only measure one of the many various aspects of SES.25 38
It is recommended that the association between perceived SES and PD be considered in the future studies.
Strengths and limitations
The strengths of the present study included the selection of patients from incident cases, a high patient response rate (93%) and a large sample size. Another strength of our study was the simultaneous use of perceived and objective SES measurement, which can provide a better understanding of the association between SES and PD. The control group in our study was selected randomly from the general population, which reduced the selection bias. However, due to the selection of controls through the RDD method, there may still have been some selection bias in the controls; the study was limited to households who had access to a traditional landline, and as a result, a small number of individuals who did not have traditional landlines were not included in the sampling frame. The control group’s response rate in the current study was 63.9%, which was higher than the average documented response rate using the RDD method.39 However, the distribution of SES among non-responders in the control group might have had an impact on the study’s findings. When measuring the main exposure in case–control studies, recall bias may potentially occur, which should also have been considered in our study.
Another advantage of our study was the use of the PCA-based wealth index to show the SES. It should be noted that there is no gold standard for measuring SES. The main advantage of the PCA-based wealth index is that it avoids many of the measurement problems (eg, recall bias and seasonality) associated with other methods of measuring SES, such as income and consumption expenditure. Wealth index is easier to measure in surveys and reduces the dimensions of data by considering all the variables33 and is generally considered as a measure of long-term wealth. Therefore, it may not show the real changes in the short-term and medium-term living standards of households.40 Moreover, this index is useful for considering inequality between households, and cannot provide information about absolute levels of poverty in society.33 40
The aforementioned limitations should be taken into account when generalising the study results to other populations.
Conclusion
The present study indicated that, based on the wealth index, both men and women from the intermediate category had lower odds of developing PD when compared with those from the deprived category. Moreover, when compared with academic education, illiteracy and/or a primary level of education decreased the odds of PD. After adjusting for confounders in both women and men, we learnt that individuals who had the lowest perceived SES had higher odds of PD compared with all other categories among the Iranian population. Given the current study’s limitations, additional studies are required to ascertain the role of various SES variables in the development of PD.
Data availability statement
Data are available on reasonable request.
Ethics statements
Patient consent for publication
Ethics approval
This study was approved by the research ethics committee of the Tehran University of Medical Sciences (IR.TUMS.MEDICINE.REC.1400.103). Participants gave informed consent to participate in the study before taking part.
Acknowledgments
We would like to thank all who participated in this study. We are grateful to Arefe Rohani and Saeedeh Barforoush for making the data collection possible.
References
Footnotes
Contributors FN: conceptualisation, data curation, original draft preparation and data analysis. MAM: data analysis, validation and original draft preparation. IA: methodology, original draft preparation and validation. MR: visualisation and writing of the original draft. FV: validation and preparation of the original draft. SN: conceptualisation, methodology and preparation of the original draft, guarantor.
Funding The authors have not declared a specific grant for this research from any funding agency in the public, commercial or not-for-profit sectors.
Competing interests None declared.
Provenance and peer review Not commissioned; externally peer reviewed.