


Abstract
To estimate the incidence of dementia after the first atrial fibrillation (AF), and its impact on survival in a community-based cohort.
Olmsted County, Minnesota adult residents diagnosed with first AF during 1986–2000 were identified, and followed until 2004. The primary outcome was new detection of dementia. Interim stroke was censored in the analyses. Of 2837 subjects (71 ± 15 years old) diagnosed with first AF and without any evidence of cognitive dysfunction or stroke at the time of AF onset, 299 were diagnosed with dementia during a median follow-up of 4.6 years [interquartile (IQR) range 1.5–7.9 years], and 1638 died. The Kaplan–Meier cumulative rate of dementia was 2.7% at 1 year and 10.5% at 5 years. After adjustment for age and sex, dementia was strongly related to advancing age [hazard ratio (HR)/10 years, 2.8; 95% confidence interval (CI), 2.5–3.2], but did not vary with sex (P = 0.52). The occurrence of post-AF dementia was associated with significantly increased mortality risk (HR 2.9; 95% CI 2.5–3.3), even after adjustment for multiple comorbidities, and did not vary with age (P = 0.75) or sex (P = 0.33).
Dementia appeared common following the diagnosis of first AF, and was associated with premature death.
Introduction
Atrial fibrillation (AF) is a growing public health problem,1 which has reached epidemic proportions.2,3 Multiple studies have shown that AF is associated with stroke4,5 congestive heart failure (CHF),6,7 and all-cause mortality.8–11 Recently, there has been increasing evidence that AF may contribute to the development of cognitive dysfunction.12–17 Notably, the cross-sectional study as part of the Rotterdam Study demonstrated that cognitive dysfunction was approximately twice as common in subjects with AF than in those without.13 Other cross-sectional studies have shown that AF was associated with cognitive dysfunction, independent of stroke and other cardiovascular risk factors.14,15 Added together, these studies suggest that patients with AF are at increased risk of cognitive dysfunction. To date, we are unaware of any published longitudinal study of the incidence of cognitive dysfunction, specifically dementia, after the diagnosis of first AF and how such a development may affect survival.
We conducted a longitudinal, community-based cohort study to assess the incidence and mortality of dementia after the first diagnosis of AF in patients without prior evidence of cognitive dysfunction or stroke at the time of AF onset.
Methods
Study setting
The community-based cohort study was approved by the Mayo Foundation Institutional Review Board. Olmsted County, Minnesota, is well suited for the conduct of studies with long-term follow-up because of a number of unique features.18 Geographically, the community is relatively isolated from other urban centres, and medical care is delivered by only a few health-care providers, principally, the Mayo Clinic and its associated hospitals. The majority of Olmsted County residents return to the Mayo Clinic on a regular basis, allowing capture of health-related events. A previous study has shown that 96% of Olmsted County women residents aged 65–74 years returned to the Mayo Clinic within a 3-year period.18 For each patient at the Mayo Clinic, a unified medical record containing details of all inpatient and outpatient encounters is maintained. Within each medical record, diagnoses made during office visits, clinic consultations, emergency room visits, hospital admissions, nursing home care, and autopsy examinations, as well as surgical procedures, are listed on a master sheet and subsequently coded. Coded diagnoses are electronically entered into a medical diagnostic index, allowing easy identification of all patients with a diagnosis of interest. An electronic electrocardiogram database has been established at Mayo since 1976, allowing rapid identification of the coded interpretation and diagnoses for each electrocardiogram. All electrocardiograms can also be retrieved for direct review.
Incident atrial fibrillation cohort and study population
The medical records of adult residents of Olmsted County, Minnesota who had first AF documented between October 1, 1986 and December 31, 2000, in any of the Mayo administrative databases (medical index, surgical index, electrocardiographic, and echocardiographic databases) were reviewed, and followed forward through medical records up to March 2004 or death by one physician (Y.M.). Since the unit record system at Mayo dated back to early 1900s, any electrocardiogram performed on any patient was contained within the unit record. All electrocardiograms performed on each person within the study cohort were assessed. Prior AF was ruled out by two methods. First, the electronic electrocardiogram database was established in 1976, and therefore all electrocardiograms with their respective diagnoses confirmed by cardiologist staff performed could be electronically searched and retrieved. We could identify the first-ever electrocardiogram showing AF from this database. In addition, within the unit record system, we could assess all electrocardiograms performed up to, as well as after 1976. So, any AF that occurred prior to the establishment of the administrative databases (including electrocardiogram database) would have been identified from the comprehensive chart review process. With these steps, we were able to identify who had first AF within the study period, and excluded anyone who had any evidence of AF prior to 1986. For the purpose of this study, we excluded subjects who had any prior history or evidence of cognitive dysfunction or stroke, as well as those who sustained a first stroke on the same day as first AF. Final inclusion in the study population required that (i) the AF was sustained allowing confirmation by 12-lead electrocardiogram; (ii) verification of the AF episode being the first recognized AF event for the person; and (iii) absence of any history or evidence of cognitive dysfunction or stroke at the time of AF diagnosis.
Definition and ascertainment of outcome
Dementia
The primary outcome of interest was a new diagnosis of dementia after first AF diagnosis. Case ascertainment was based on the confirmation of dementia by a neurologist at the Mayo Clinic confirmed by formal neuropsychometric testing. The diagnosis of dementia was based on the standard diagnostic criteria as listed in the Diagnostic and Statistical Manual of Mental Disorders (DSM).19–21
Stroke
Stroke included development of any type of stroke, as defined by clinical documentation of the diagnosis with or without confirmatory findings on computed tomography, magnetic resonance imaging, or autopsy. In 96.8% of cases, the diagnosis was confirmed by imaging studies or autopsy. Ischaemic stroke was defined as the acute onset of a focal neurological deficit persisting for more than 24 h, compatible with altered circulation to a limited region of the cerebral hemispheres, brainstem, or cerebellum.22 Persons with an area of probable infarction on imaging studies but without any associated clinical symptoms were not included. Haemorrhagic stroke was defined as the acute onset of a focal neurological deficit associated with some or all of the following: headache, vomiting, altered level of consciousness, signs of meningeal irritation, or blood-stained cerebrospinal fluid.
Death
The secondary outcome of interest was death. Ascertainment of death was accomplished through comprehensive review of medical records, death certificates, Vital Status Information from Mayo Registration, Minnesota State Death Tapes, and Social Security Death Index.
Statistical analyses
Baseline characteristics were summarized in Table 1 by means and standard deviations for continuous variables, or frequency percents for binary variables. Average annual incidence rates were reported by sex and by 5-year age intervals, and the data were tabulated as cases per 1000 person-years. The cumulative incidence of dementia detection after the diagnosis of first AF was estimated using Kaplan–Meier method. The rate of dementia detection was assessed using Cox proportional hazards modelling, with age and sex in the model. Cox models based on clinical variables at the time of first AF were also developed using backward and stepwise selection. The clinical covariates considered included type of AF (paroxysmal vs. chronic) at initial diagnosis, body mass index, systolic or diastolic blood pressure, heart rate at first AF diagnosis; history of myocardial infarction, systemic hypertension, dyslipidaemia, diabetes mellitus, smoking, peripheral or carotid artery disease, congestive heart failure, valvular heart disease, regular alcohol use, hyperthyroidism, chronic renal disease, chronic obstructive pulmonary disease, and malignancy.
Baseline characteristics of the population with incident atrial fibrillation
| Variable | Overall (N = 2837) |
|---|---|
| Age (years) | 71 ± 15 |
| Men | 1517 (53) |
| Body mass index (kg/m2) | 27.8 ± 6.4 |
| Systolic blood pressure (mmHg) | 137 ± 20 |
| Diastolic blood pressure (mmHg) | 77 ± 11 |
| Heart rate at AF (b.p.m.) | 113 ± 32 |
| Paroxysmal AF | 2 180 (77) |
| Prior myocardial infarction | 549 (19) |
| Valvular heart disease | 700 (25) |
| Prior congestive heart failure | 243 (9) |
| Peripheral artery disease | 323 (11) |
| Carotid artery disease | 92 (3) |
| Systemic hypertension | 2 263 (80) |
| Diabetes mellitus | 476 (17) |
| Dyslipidaemia | 1 269 (45) |
| Smoking | 1 660 (59) |
| Regular alcohol use | 356 (13) |
| Chronic renal disease | 433 (15) |
| Chronic pulmonary disease | 592 (21) |
| Hyperthyroidism | 28 (1.0) |
| History of malignancy | 805 (28) |
Values are given as mean ± SD or number (percentage).
For subsequent overall mortality analysis, the time to the diagnosis of dementia was considered as a time-dependent covariate in the Cox proportional hazards model with age and sex, as well as clinical variables, in the models. Clinical covariates selected for adjustment included body mass index, history of myocardial infarction, congestive heart failure, valvular heart disease, systemic hypertension, diabetes mellitus, dyslipidaemia, smoking, chronic renal disease, chronic obstructive pulmonary disease, and malignancy.
Mortality ratios relative to the general Minnesota white population were calculated by dividing the observed number of mortality events by an ‘expected number’ of deaths. This expected number was calculated as the sum of each individual's cumulative hazard, based on the standard age, sex, and calendar year-specific life-table survival probability up to the individual's follow-up time. Confidence intervals (CI) were based on the Poisson distribution. In all analyses, those who had interim stroke development were censored because of a possible intermediate in the relation between AF and dementia (N = 290, accounting for 55 dementia).23,24 All tests of significance were two-tailed, and P-value <0.05 was considered statistically significant.
Results
A total of 3484 subjects (73 ± 14 years old, 52% men) were confirmed to have an initial diagnosis of AF between 1986 and 2000. After review of the medical records, 239 subjects were excluded because of a history of cognitive dysfunction with or without dementia, 334 because of a history of stroke, 60 because of a history of both stroke and cognitive dysfunction with or without dementia, and 14 because of uncertainty regarding stroke and cognitive function status. Therefore, the study population consisted of the remaining 2837 subjects (71 ± 15 years old; range 18–107, 53% men). The baseline characteristics are displayed in Table 1.
By virtue of the exclusion criteria determined a priori, we expected that there would be differences between those who were included (N = 2,837) vs. those who were excluded (N = 647) in terms of age and vascular risk factors. Indeed, those excluded from the analysis were older, had higher systolic blood pressure, and were more likely to have had a history of myocardial infarction, congestive heart failure, peripheral or carotid artery disease, systemic hypertension, and diabetes mellitus (all P < 0.01).
Risk of dementia after atrial fibrillation
During a mean follow-up time of 5.2 ± 4.2 (median 4.6; IQR 1.5–7.9) years, 299 subjects were diagnosed with dementia, with an estimated overall incidence rate of 22.5 per 1000 person-years. The rate of dementia was 2.7% (95% CI, 2.0–3.3) over the first year, and approximately 2.0% per year thereafter, with a cumulative event rate of 10.5% at 5 years (95% CI, 9.1–11.9). Sex-specific detection rates per 1000 person-years and Kaplan–Meier-estimated cumulative risk of dementia, by 5-year age increments, are shown in Table 2. The risk for dementia increased sharply with advancing age [hazard ratio (HR)/10 years, 2.83; 95% CI 2.47–3.23]. The number of men aged ≥90 years (N = 46) was too small for meaningful analysis and interpretation. The age-adjusted rate of detecting dementia was not different between men and women (P = 0.52).
Age- and sex-specific incidence rates and Kaplan–Meier-estimated cumulative incidence of dementia after the first atrial fibrillation diagnosis
| Age (years) | N | Person-years | Incidence rate/1000 person-yearsa | Kaplan–Meier-estimated cumulative incidence | ||
|---|---|---|---|---|---|---|
| 1 year, % (95%CI) | 3 years, % (95%CI) | 5 years, % (95%CI) | ||||
| Overall | 2837 | 13297.56 | 22.49 (299) | 2.7 (2.0–3.3) | 7.0 (5.9–8.1) | 10.5 (9.1–11.9) |
| Men | ||||||
| <50 | 206 | 1434.97 | 0.70 (1) | 0.0 (0.0–0.0) | 0.0 (0.0–0.0) | 0.8 (0.0–2.2) |
| 50–54 | 71 | 457.83 | 0.00 (0) | 0.0 (0.0–0.0) | 0.0 (0.0–0.0) | 0.0 (0.0–0.0) |
| 55–59 | 108 | 680.49 | 1.47 (1) | 0.0 (0.0–0.0) | 0.0 (0.0–0.0) | 0.0 (0.0–0.0) |
| 60–64 | 136 | 800.03 | 5.00 (4) | 0.0 (0.0–0.0) | 0.9 (0.0–2.6) | 0.9 (0.0–2.6) |
| 65–69 | 216 | 1258.28 | 4.77 (6) | 0.6 (0.0–1.7) | 1.8 (0.0–3.9) | 3.2 (0.4–5.9) |
| 70–74 | 234 | 1118.07 | 20.57 (23) | 1.9 (0.0–3.8) | 4.9 (1.7–7.9) | 6.2 (2.6–9.8) |
| 75–79 | 231 | 918.73 | 34.83 (32) | 2.0 (0.0–4.0) | 8.2 (4.0–12.2) | 12.3 (6.8–17.5) |
| 80–84 | 157 | 497.61 | 58.28 (29) | 7.7 (3.0–12.2) | 14.4 (7.8–20.6) | 19.4 (10.8–27.1) |
| 85–89 | 112 | 267.25 | 59.87 (16) | 2.2 (0.0–5.3) | 19.6 (8.2–29.6) | 30.3 (15.4–42.6) |
| ≥90 | 46 | 87.01 | 45.97 (4) | 4.3 (0.0–12.3) | 4.3 (0.0–12.3) | 23.9 (0.0–45.5) |
| Women | ||||||
| <50 | 52 | 372.03 | 0.00 (0) | 0.0 (0.0–0.0) | 0.0 (0.0–0.0) | 0.0 (0.0–0.0) |
| 50–54 | 28 | 221.94 | 0.00 (0) | 0.0 (0.0–0.0) | 0.0 (0.0–0.0) | 0.0 (0.0–0.0) |
| 55–59 | 60 | 364.02 | 0.00 (0) | 0.0 (0.0–0.0) | 0.0 (0.0–0.0) | 0.0 (0.0–0.0) |
| 60–64 | 72 | 496.77 | 4.03 (2) | 1.6 (0.0–4.7) | 1.6 (0.0–4.7) | 1.6 (0.0–4.7) |
| 65–69 | 111 | 684.47 | 4.38 (3) | 0.0 (0.0–0.0) | 0.0 (0.0–0.0) | 1.3 (0.0–3.9) |
| 70–74 | 184 | 874.26 | 17.16 (15) | 1.9 (0.0–4.1) | 5.1 (1.3–8.7) | 6.9 (2.4–11.2) |
| 75–79 | 216 | 1031.91 | 44.58 (46) | 3.3 (0.7–5.8) | 7.6 (3.5–11.4) | 16.1 (9.9–22.0) |
| 80–84 | 264 | 914.07 | 55.79 (51) | 5.5 (2.4–8.5) | 13.5 (8.4–18.2) | 22.6 (15.7–28.9) |
| 85–89 | 190 | 529.62 | 71.75 (38) | 8.8 (4.1–13.3) | 23.3 (15.4–30.4) | 29.7 (19.9–38.3) |
| ≥90 | 143 | 288.20 | 97.15 (28) | 6.0 (1.2–10.6) | 20.9 (11.3–29.4) | 33.9 (19.2–45.9) |
aData are presented as incidence rates, followed in parentheses by the actual number of cases observed.
Clinical associations with dementia
In a multivariable Cox model for the prediction of dementia, advancing age (HR/10 years 2.91, 95% CI 2.53–3.34), history of diabetes mellitus (HR 1.68, 95% CI 1.24–2.27) were independently predictive of dementia. A self reported regular use of alcohol of more than one drink per day was negatively associated with dementia marginally (HR 0.58, 95% CI 0.34–1.01, P = 0.053). Higher blood pressure and history of systemic hypertension were not independently associated with dementia.
Impact of dementia on survival
During the follow-up period, 1638 subjects died. The mortality risk for those who incurred a diagnosis of dementia, relative to those who did not, was significantly higher (HR 2.86, 95% CI, 2.47–3.31), and the mortality risk did not vary with age (P = 0.75) or sex (P = 0.33). After adjusting for additional risk factors including body mass index, history of myocardial infarction, valvular heart disease, congestive heart failure, systemic hypertension, diabetes mellitus, dyslipidaemia, smoking, chronic renal disease, chronic obstructive pulmonary disease, and malignancy, the diagnosis of dementia remained a significant independent predictor of death (HR 2.94, 95% CI, 2.54–3.41). Compared with the age-matched general Minnesota population, the relative mortality HRs were 1.81 (95% CI, 1.70–1.95) prior to, and 3.49 (95% CI, 2.57–5.03) following the development of dementia in men. For women, the HRs were 1.87 (95% CI, 1.75–2.02) and 3.02 (95% CI, 2.47–3.89), respectively. The number of observed and expected deaths for the entire period, and separately for both before and after the diagnosis of dementia, are shown in Table 3.
Sex-specific mortality hazard ratios relative to the age-matched general Minnesota white population after first atrial fibrillation diagnosis
| Men | Women | |||||
|---|---|---|---|---|---|---|
| Observed | Expected | Ratio (95%CI) | Observed | Expected | Ratio (95%CI) | |
| Overall | 796 | 414.04 | 1.92 (1.80–2.06) | 842 | 418.58 | 2.01 (1.88–2.16) |
| Pre-dementia | 702 | 387.08 | 1.81 (1.70–1.95) | 691 | 368.66 | 1.87 (1.75–2.02) |
| Post-dementia | 94 | 26.96 | 3.49 (2.57–5.03) | 151 | 49.92 | 3.02 (2.47–3.89) |
Discussion
Our community-based cohort of patients diagnosed with first AF, followed longitudinally, provided evidence that (1) new detection of dementia was common independent of stroke, and the risk increased with advancing age, but did not vary with sex; and (2) the diagnosis of dementia conferred excess risk of death without gender difference.
Risk of dementia after atrial fibrillation
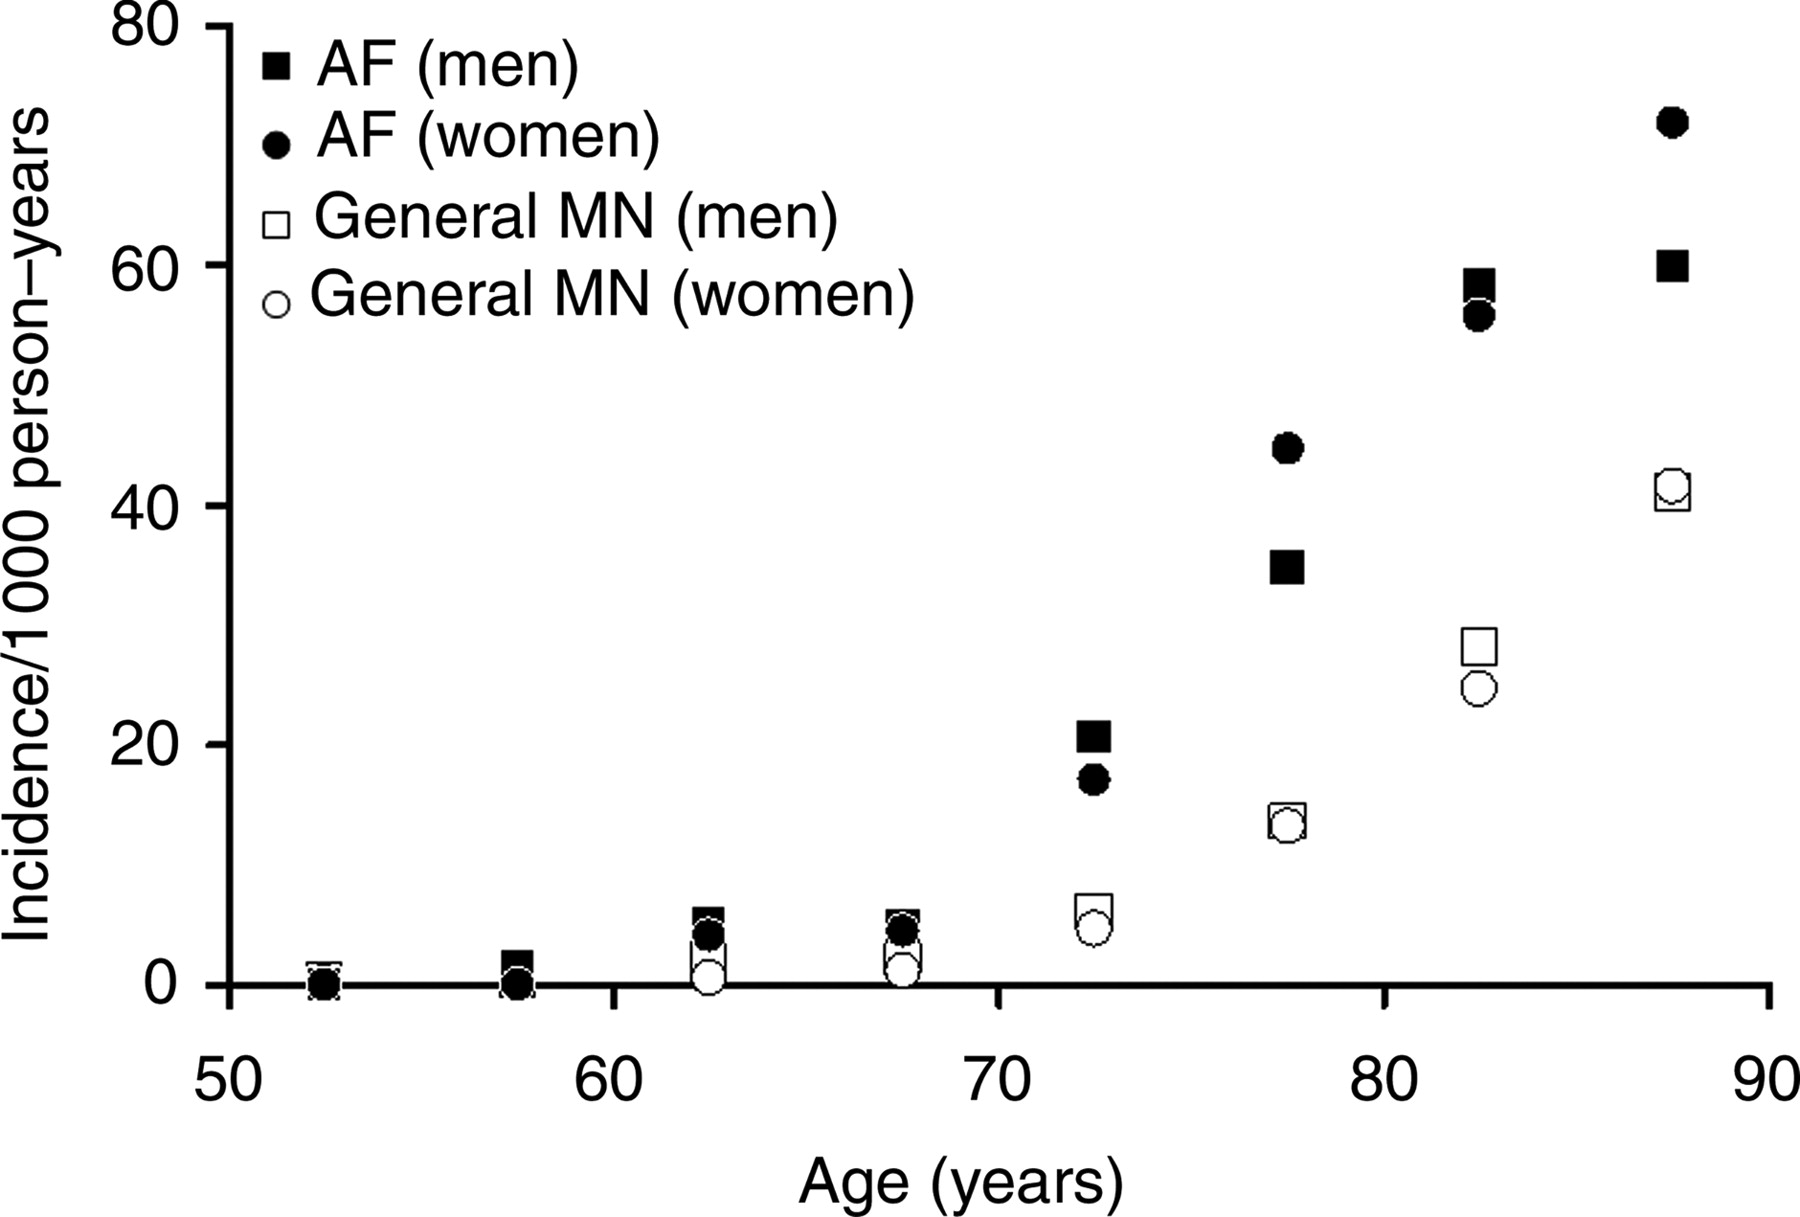
Our data suggested that the development of dementia is common after the diagnosis of first AF. As a comparison with other common adverse outcomes of AF, the incidence of dementia following the first diagnosis of AF (Kaplan–Meier estimated rate, 10.5% at 5 years; incidence rate, 22.5 per 1000 person-years) was similar to that of stroke (9.7% at 5 years; 20.7 per 1000 person-years, respectively),22 but lower than that of congestive heart failure (20.0% at 5 years; 43.8 per 1000 person-years, respectively) in the same cohort.25 In a prior study, it was reported that the incidence of dementia in the general Olmsted County, Minnesota population, for persons aged 50 years and older, was 6.8 per 1000 person-years.26 Although a direct comparison is impossible, the age-stratified incidence of dementia in our AF cohort appeared considerably higher than that reported for the general population26 (Figure 1). For the age group 60–64 years, the incidence of dementia (per 1000 person-years) was 2.1 in men, and 0.7 in women in the general population, when compared with 5.0 in men, and 4.0 in women in our AF cohort. For the age group 80–84 years, the incidence was 28.1 in men and 24.7 in women in the general population, when compared with 58.3 in men and 55.8 in women in our AF cohort (Figure 1).

Incidence of dementia per 1000 person-years, stratified by age, in the general Rochester, Minnesota population,26 and in the present atrial fibrillation cohort. The values plotted are the midpoints of the age ranges.
Clinical associations with dementia
In the present study, advancing age and history of diabetes mellitus were independent predictors of dementia. The relation of age to cognitive dysfunction is well known.27 There is also evidence for an increased risk of cognitive dysfunction with diabetes mellitus.28,29 Although some studies have suggested that high blood pressure or systemic hypertension are risk factors for cognitive dysfunction,28,30,31 others have failed to demonstrate a consistent relationship between these variables and cognitive dysfunction.32,33 In our study, the relationship between blood pressure variables or a history of hypertension and subsequent diagnosis of dementia did not reach significance. Interestingly, regular alcohol use, on the other hand, was marginally associated with a lower risk of dementia, which had also been reported by other studies.34,35
Although our study could not prove a cause and effect relationship between AF and dementia, potential and plausible mechanisms for the relationship do exist. It has been suggested that AF is associated with an increased risk of asymptomatic or ‘silent’ cerebral infarction,36,37 and as a result may confer an increased risk of cognitive dysfunction.38 The underlying mechanism could be thrombo-embolic related to the absence of left atrial mechanical activity. An alternative haemodynamic mechanism is the beat-to-beat variability in cardiac cycle length in AF and therefore variations in cerebral perfusion.39 In support of that, leukoariosis or white matter hyperintensities have been considered as markers of cerebral hypoperfusion40 and hence anatomic evidence for cognitive dysfunction, and these are frequently identified in patients with AF.41 Also, many of the patients with AF have multiple comorbid conditions,42 and are at risk of cognitive dysfunction also from these concurrent pathologies.
Impact of dementia on survival
It has previously been recognized that AF confers excess mortality risk.8–11 Although it is possible that the diagnosis of dementia after AF is a marker of other comorbidities, our data suggested an independent effect of dementia on mortality, even after adjustment for age, sex, and multiple clinical comorbidities. In our study, before dementia, AF was associated with a relative hazard mortality of 80% above that of age-expected for both men and women in the general population. After dementia, the relative hazard mortality was approximately three times that of age-expected for both men and women. Further studies to explain these observations are necessary which may have major impact on not only survival, but as well, the quality of life in older age.
Limitations
We acknowledge that there are inherent biases associated with the retrospective design of this cohort study. Patients with dementia who did not reach medical attention could have been missed, and therefore, under ascertainment was possible leading to a lower estimate of the risk of dementia after AF. Detailed data with respect to the use of medical therapy, and level of education, were not readily available. How these factored into the identification of new cases of dementia could not be determined. Silent stroke and transient ischaemic attack could have contributed to the development of dementia. However, our study did not allow detailed analysis of the impact of these conditions on our assessment of the relationship between AF and dementia. The population of the Olmsted County, Minnesota is predominantly white and not racial-ethnically diverse.
Conclusion
In this community-based cohort of first AF subjects, new detection of dementia was common in both men and women, which conferred excess mortality risk. Prospective studies are warranted to determine the underlying mechanisms for such a relationship. Addressing these issues may have major impact on not only survival, but as well, the quality of life in patients with AF, which is a major public health problem.
Acknowledgement
This study was supported by the American Heart Association National Scientist Development Grant. There is no financial conflict on the part of any of the authors.
Conflict of interest: none declared.
Appendix
Definition of covariates
Body mass index was calculated as weight (in kilograms) divided by the square of height (in meters) (kg/m2) at the time of AF diagnosis. Systolic and diastolic blood pressures were defined by mean blood pressure on two occasions that were nearest prior first AF diagnosis. Heart rate at AF was defined by heart rate on 12-lead electrocardiogram at the time of AF diagnosis. Chronic vs. paroxysmal AF was defined by whether there were recognizable intervening episodes of sinus rhythm. Myocardial infarction was defined by at least two of the three diagnostic criteria: compatible clinical presentation, diagnostic cardiac enzyme levels, and consistent electrocardiographic changes. Valvular heart disease was defined by greater than mild stenosis or regurgitation by echocardiography, or prior valve repair/replacement. Congestive heart failure was defined by the presence of two major, or one major and two minor Framingham criteria.43 Carotid artery disease was defined by the presence of at least 50% stenosis based on neurovascular imaging, or prior intervention. Systemic hypertension was defined by a physician's diagnosis, need for antihypertensive therapy, systolic blood pressure >140 mmHg, or diastolic blood pressure >90 mmHg on at least two occasions that were not associated with acute illness or injury. Diabetes mellitus was defined by physician's diagnosis, and treatment with insulin or oral hypoglycaemic agents. Dyslipidaemia was defined by a total cholesterol ≥200 mg/dL, triglycerides ≥150 mg/dL, LDL cholesterol ≥130 mg/dL, or HDL cholesterol <40 mg/dL on two or more occasions, or treatment with lipid-lowering agents. Smoking history was classified as past (over 6 months prior) or current smoker. Regular alcohol use was defined by self-reported consumption in more than one drink per day regularly. Chronic renal disease, chronic obstructive pulmonary disease, and hyperthyroidism were defined by these clinical diagnoses in the medical records.
References
Author notes
This paper was guest edited by R. Whitmer

