Article Text

Abstract
Background Several non-motor features may individually contribute to identify prodromal Parkinson’s disease (PD), but little is known on how they interact.
Methods We conducted a case–control study nested within the Health Professionals Follow-up Study in a large cohort of men age 40–75 at recruitment in 1986. Cases (n=120) had confirmed PD, were<85 in January 2012, returned a 2012 questionnaire with questions on probable rapid eye movement sleep behaviour disorder (RBD) and constipation sent to all cohort participants and completed in 2014 the Brief Smell Identification Test and a questionnaire assessing parkinsonism and other non-motor PD features (including depressive symptoms, excessive daytime sleepiness, impaired colour vision and body pain). Controls (n=6479) met the same criteria as cases, except for the PD diagnosis.
Results Concurrent constipation, probable RBD and hyposmia were present in 29.3% of cases and 1.1% of controls, yielding an age-adjusted OR of 160(95%CI 72.8to353) for three features versus none. The odds of PD increased exponentially with additional non-motor features (OR for 6–7 features versus none: 1325; 95%CI333to5279). Among men without PD, the number of non-motor features was associated with odds of parkinsonism (OR for 6–7 features versus none: 89; 95%CI21.2to375). We estimated that in a population with a prodromal PD prevalence of 2%, concurrent constipation, probable RBD and hyposmia would have a maximum sensitivity of 29% and a positive predictive value (PPV) of 35%. The PPV could increase up to 70% by including additional features, but with sharply decreased sensitivity.
Conclusions Concurrent constipation, probable RBD and hyposmia are strongly associated with PD. Because these features often precede motor symptoms and their co-occurrence could provide an efficient method for early PD identification.
Statistics from Altmetric.com
Introduction
Parkinson’s disease (PD) is a progressive movement disorder affecting approximately 9.1 out of 1000 individuals over age 65.1 At the time of clinical diagnosis of PD, patients have typically already experienced substantial neuronal loss.2 3 Clinical PD is preceded by a prodromal period characterised by non-motor features, which can include rapid eye movement (REM) sleep behaviour disorder (RBD), hyposmia and constipation, among others.2 4–6 Identifying individuals during this prodromal period offers the possibility of recognising individuals who might benefit from the study of potential neuroprotective therapies. Therefore, we have conducted a nested case–control study among participants in the Health Professionals Follow-up Study (HPFS) to assess cross-sectional associations between non-motor features and prevalent PD. Because these features commonly precede PD diagnosis, strong associations could suggest that these features would be suitable for use in screening protocols for PD.
Materials and methods
Source population
The HPFS was established in 1986 when 51 529 male health professionals aged 40–75 living in the USA responded to mailed questionnaires about their medical histories and health-related behaviours. Follow-up questionnaires have been sent every 2years to update disease and exposure data. The 2012 questionnaire included for the first time a question on probable RBD (pRBD), in addition to questions on constipation or use of laxatives. Participants were eligible for the current study if they met the following criteria: (1) responded to the 2012 questionnaire and had non-missing responses to questions regarding constipation and pRBD (because the pRBD screening question was asked to the sleep partner of the participant, men without a sleep partner were excluded (n=879 of those otherwise eligible)), (2) were under age 85 on 1 January 2012 and (3) were alive and eligible to receive mailings in September 2014.
Identification of PD cases and controls
Procedures for identifying PD cases have previously been described.7 Briefly, participants were asked on biennial questionnaires to report new disease diagnoses. When a participant reported a PD diagnosis, we requested the patients’ medical records, which were then reviewed by a neurologist specialising in movement disorders. Cases were confirmed if the medical record included either a final diagnosis of PD by a neurologist or evidence of at least two of the three cardinal PD signs (rest tremor, rigidity and bradykinesia) in the absence of features suggesting other diagnoses. One hundred and sixty-one individuals with confirmed PD met the eligibility requirements and were invited to participate.
Because of the large number of potential controls, to reduce costs, we selected as controls all individuals who screened positive for either constipation or pRBD on the 2012 questionnaire (n=5472), but only 2854(23%) men were randomly selected from those without constipation or pRBD. The bias (attenuation of OR) resulting from undersampling controls without constipation or pRBD was corrected by inverse probability weighting.8 One hundred and twenty individuals with PD and 6479 controls completed the 2014 assessments and were included in the analyses.
Assessments
On the 2012 questionnaire, participants were asked to report frequency of bowel movements and laxative use (including softeners, bulking agents, fibre supplements or suppositories). Constipation was defined as a bowel movement frequency of every other day or less and/or laxative use at least twice a week. pRBD was assessed using an RBD screening question from the validated Mayo Sleep Questionnaire that investigated dream enactment behaviour and violent or excessive movement during sleep (‘Has your spouse (or sleep partner) told you that you appear to “act out your dreams” while sleeping (punched or flailed arms in the air, shouted or screamed), which has occurred at least three times?’).9 This question, but without the specification of dream enactment having occurred at least three times, has been reported to have a sensitivity of 100% and a specificity of 95% for the diagnosis of polysomnography (PSG)-confirmed RBD in a community-based sample.10 This question was also asked on the 2014–2015 questionnaire, along with the remaining RBD questions from the Mayo Sleep Questionnaire (online supplementary figure 1). Olfaction was assessed using the B-SIT, which is a standardised, forced choice test consisting of a booklet containing 12 odorants; participants were asked to identify each odorant from a list of four alternatives.11 An olfactory score was calculated for each participant by summing the number of correctly identified odours, and hyposmia was defined as an olfactory score in the bottom 10% of individuals who screened negative for pRBD and constipation. Additionally, we asked participants whether they perceived that they had smell or taste problems (online supplementary figure 1).
Supplemental material
We assessed colour discrimination using a mailed version of the Roth colour discrimination test, which is an abridged version of the Farnsworth-Munsell Test.12 This version (online supplementary figure 2) was developed specifically for this study and was validated by comparison with an in-person administered Farnsworth-Munsell (see below). Colour discrimination error scores were calculated by summing the number of incorrectly matched colour hues. We used the top 10% of error scores among individuals without pRBD or constipation, since our cohort was enriched for these features, as a cut-off for low colour discrimination. Excessive daytime sleepiness was measured using the Epworth Sleepiness Scale,13 with a score of ≥10 considered to have possible excessive daytime sleepiness. Depressive symptoms were measured using the Mental Health Inventory,14 a five-item subscale of the 36-item Short-Form Health Survey (SF36). Presence and severity of body pain was also measured using questions from the SF36 (online supplementary figures 1). We used a nine-item self-administered screening questionnaire for parkinsonism that captured self-reported changes in motor function.15 A motor score was calculated for each participant by summing the number of self-reported changes. A cut-off of 4 was used to define probable parkinsonism, which in previous research achieved a sensitivity of 90% and a specificity of 94% for neurologist-confirmed parkinsonism.16
Validation of colour test and parkinsonism questionnaire
To validate our mailed colour discrimination test as well as the parkinsonism screening questionnaire, we conducted mobile clinic assessments of a subset of 51 participants, including 23 individuals with pRBD, constipation and hyposmia, 12 with none of these three signs and 16 with PD, including one in which the original diagnosis was changed by his treating neurologist to dystonia before the validation study. The assessments were conducted by neurologists specialising in movement disorders, who administered the Movement Disorder Society-Unified Parkinson's Disease Rating Scale (MDS-UPDRS) part 3 and, for 28 participants, the physical version of the Farnsworth-Munsell 100 hue test. The MDS-UPDRS part 2 was self-administered by subjects. The Spearman correlation coefficient between the mailed version of the Roth colour discrimination test and the Farnsworth-Munsell 100 hue test was 0.73 (p<0.0001). The Spearman correlation coefficient of the parkinsonism screening questionnaire with the MDS-UPDRS part 2 (‘Motor experiences of daily living’) was 0.80 (p<0.0001), and with part 3 (‘Motor examination’) was 0.64 (p<0.0001). The diagnosis of PD was confirmed in 14 (93%) of the 15 cases; the remaining case was diagnosed with progressive supranuclear palsy.
Statistical analysis
We estimated the prevalence of non-motor features in cases and controls as the proportion reporting the conditions on the 2012 questionnaire for constipation and pRBD and on the 2014 questionnaire for other features. Since only a sample of PD-free individuals without pRBD or constipation were invited to participate in the second stage of testing including the supplementary questionnaire and smell test, participants were weighted by the inverse of their probability of being selected into the study, conditional on pRBD and constipation status. We used logistic regression to estimate age-adjusted odds ratios (ORs) for associations between non-motor features and of these features alone or in combinations with confirmed PD. We initially examined the combination of pRBD, constipation and hyposmia because these features are clearly related to PD risk, appear to precede the onset of clinical PD and can be captured with brief, well-validated measures.6 10 11 17 We then considered whether additional features (including depressive symptoms, impaired colour vision, excessive daytime sleepiness and body pain) could improve the identification of clinical PD. We plotted the receiver operating characteristic (ROC) curve for PD and estimated the area under the curve (AUC) associated with a variable representing the number of non-motor features (0 through ≥6). Finally, among individuals without PD, we used logistic regression to estimate age-adjusted ORs for associations of non-motor features with probable parkinsonism and plotted ROC curves for parkinsonism based on the number of non-motor features. All p values reported are based on two-tailed statistical tests. All analyses were performed using SAS statistical software or R V.3.4.0 (weighted ROC package).
Results
The prevalence of non-motor features among cases and controls are presented in table 1. In age-adjusted analyses among men without PD, many but not all non-motor features were positively associated with each other (online supplementary table 1). All individual features were significantly associated with PD, with ORs ranging from 2.61to19.02 (table 1). Associations between non-motor features and PD according to disease duration (≤4years duration and>4 years duration) are presented in the online supplementary table 2. ORs were to be stronger for longer standing PD, but generally did not differ markedly.
Supplemental material
Prevalence of non-motor features among PD cases and controls
Combined non-motor features
Constipation, pRBD and hyposmia
The odds of PD (figure 1) increased exponentially with the number of these non-motor features. Overall, the combination of constipation, pRBD and hyposmia was present in 29.3% of the PD cases and 1.1% of the controls, yielding an OR of 160 (95% CI 72.8 to 353; p<0.0001) for individuals with these three features as compared with those with none. Assuming that these features consistently precede the diagnosis of PD, as supported by most studies,18 the proportion of positive cases in our cohort (29.3%) could be considered as an approximation of the maximum sensitivity of these three features for a diagnosis of prodromal PD. To the extent that these features sometimes develop after the clinical diagnosis of PD, this sensitivity would be lower. The specificity would be greater than (100–1.1)=98.9%, because the rate of false positive has to be lower than the overall prevalence of positivity among controls (1.1%). Figure 2 shows ROC curves for PD based on the number of these non-motor signs (constipation, pRBD and hyposmia). Further calculations would require an estimate of the true prevalence of prodromal PD in the population of interest. For example, if the prevalence of true symptomatic prodromal PD in our cohort of elderly men were 2% (a value chosen for illustrative purpose, but close to actual prevalence,19 the proportion of true positives would be close to 2%×29.3%=0.59%; assuming a conservative specificity of 98.9%, the proportion of false positives would be 98%×1.1%=1.08%, and the positive predictive value (PPV) would be higher than 0.59%/ (0.59%+1.08%)=35%. This PPV could be higher in populations with higher prevalence of prodromal PD (figure 3).

Age-adjusted associations between number of non-motor features, including (A) constipation, probable rapid eye movement sleep behaviour disorder (pRBD) and hyposmia and Parkinson’s disease (PD) and (B) constipation, pRBD, hyposmia, impaired colour vision, depressive symptoms, excessive daytime sleepiness and body pain and PD; reference group is those with none of these features.

ROC curve for PD using model with variable for number of non-motor features, including (A) hyposmia, pRBD and constipation (0–3) and (B) hyposmia, pRBD, constipation, excessive daytime sleepiness, impaired colour vision, body pain and depressive symptoms (0 to ≥6). AUC, area under the curve; PD, Parkinson’s disease; pRBD, probable rapid eye movement sleep behaviour disorder; ROC, receiver operating characteristic.

Relationship between PPV and score, assuming prevalence of PD of 1%, 2% or 3%. Using strategy of screening for constipation and pRBD, followed by (A) hyposmia testing and (B) hyposmia, impaired colour vision, excessive daytime sleepiness, depressive symptoms and body pain screening. Tables in both (A) and (B) shows number of false positives, true positives and PPV% using this screening strategy with a given cut-off point in a hypothetical cohort of 10 000 older men, assuming a prevalence of 2% (ie, 200 true cases); the corresponding PPV is shown by the green line in graph above. PD, Parkinson’s disease; PPV, positive predictive value; pRBD, probable rapid eye movement sleep behaviour disorder.
Other non-motor features
The odds of PD further increased when additional non-motor features were present; the OR for PD increased to 1325(95%CI 333to5279; p<0.0001) among men with at least six features (figure 1B). The prevalence of 6–7 non-motor features was 11.45% among PD cases and only 0.10% among controls, suggesting that this combination has a low maximum sensitivity for a diagnosis of PD (approximately 11.5%), but high specificity (approximately 100–0.10=99.9%). We plotted ROC curves for PD based on number of non-motor signs (0 through≥6); the AUC for PD was 0.879(95%CI 0.841to0.915) (figure 2B). The best diagnostic accuracy for PD (where sensitivity+specificity is maximised) was achieved by using a cut-off of two non-motor features (sensitivity=87%, specificity=74) followed closely by three features (sensitivity=66%, specificity=91%). Replacing hyposmia measured using the B-SIT with hyposmia measured via self-report resulted in a modest reduction of AUC from 0.879to0.870(95%CI 0.830to0.909). Replacing pRBD measured using the single screening question with pRBD based on additionally responding affirmatively to the four additional RBD-related questions on the Mayo Sleep Questionnaire resulted in a reduction of AUC from 0.879to0.864 (95% CI 0.821 to 0.899). The figure 3B shows the relationship between number of non-motor features and PPV for PD, as well as the number of true and false positives for different numbers of non-motor features, as a function of the hypothetical prevalence of PD in the screened population. Assuming a prevalence in a screened population of 2%, PPV increases with higher scores to a maximum of 70% for ≥6 non-motor signs, with a tradeoff of fewer true positive cases identified.
Associations between non-motor features and parkinsonism
Among confirmed PD cases, 103(85.8%) were classified as having probable parkinsonism based on their responses to the self-administered screening questionnaire. Among men without PD, 545 men were classified as having probable parkinsonism. We examined associations between non-motor features and parkinsonism among men without PD. All features were significantly associated with parkinsonism (table 2). As with PD, having multiple non-motor features was strongly associated with parkinsonism. The OR for parkinsonism for men with constipation, pRBD and hyposmia was 3.9(95%CI 2.4to6.2), increasing to 89(95%CI 21.2to375, p<0.0001) among men with at least six non-motor features (figure 4). ROC curves for parkinsonism based on the number of non-motor signs are shown in figure 5. The AUC for parkinsonism based on pRBD, constipation and hyposmia was 0.607(95%CI 0.580to0.638); this AUC increased to 0.727(95%CI 0.694to0.758) by including additional features.
Associations of non-motor features with screening positive for parkinsonism
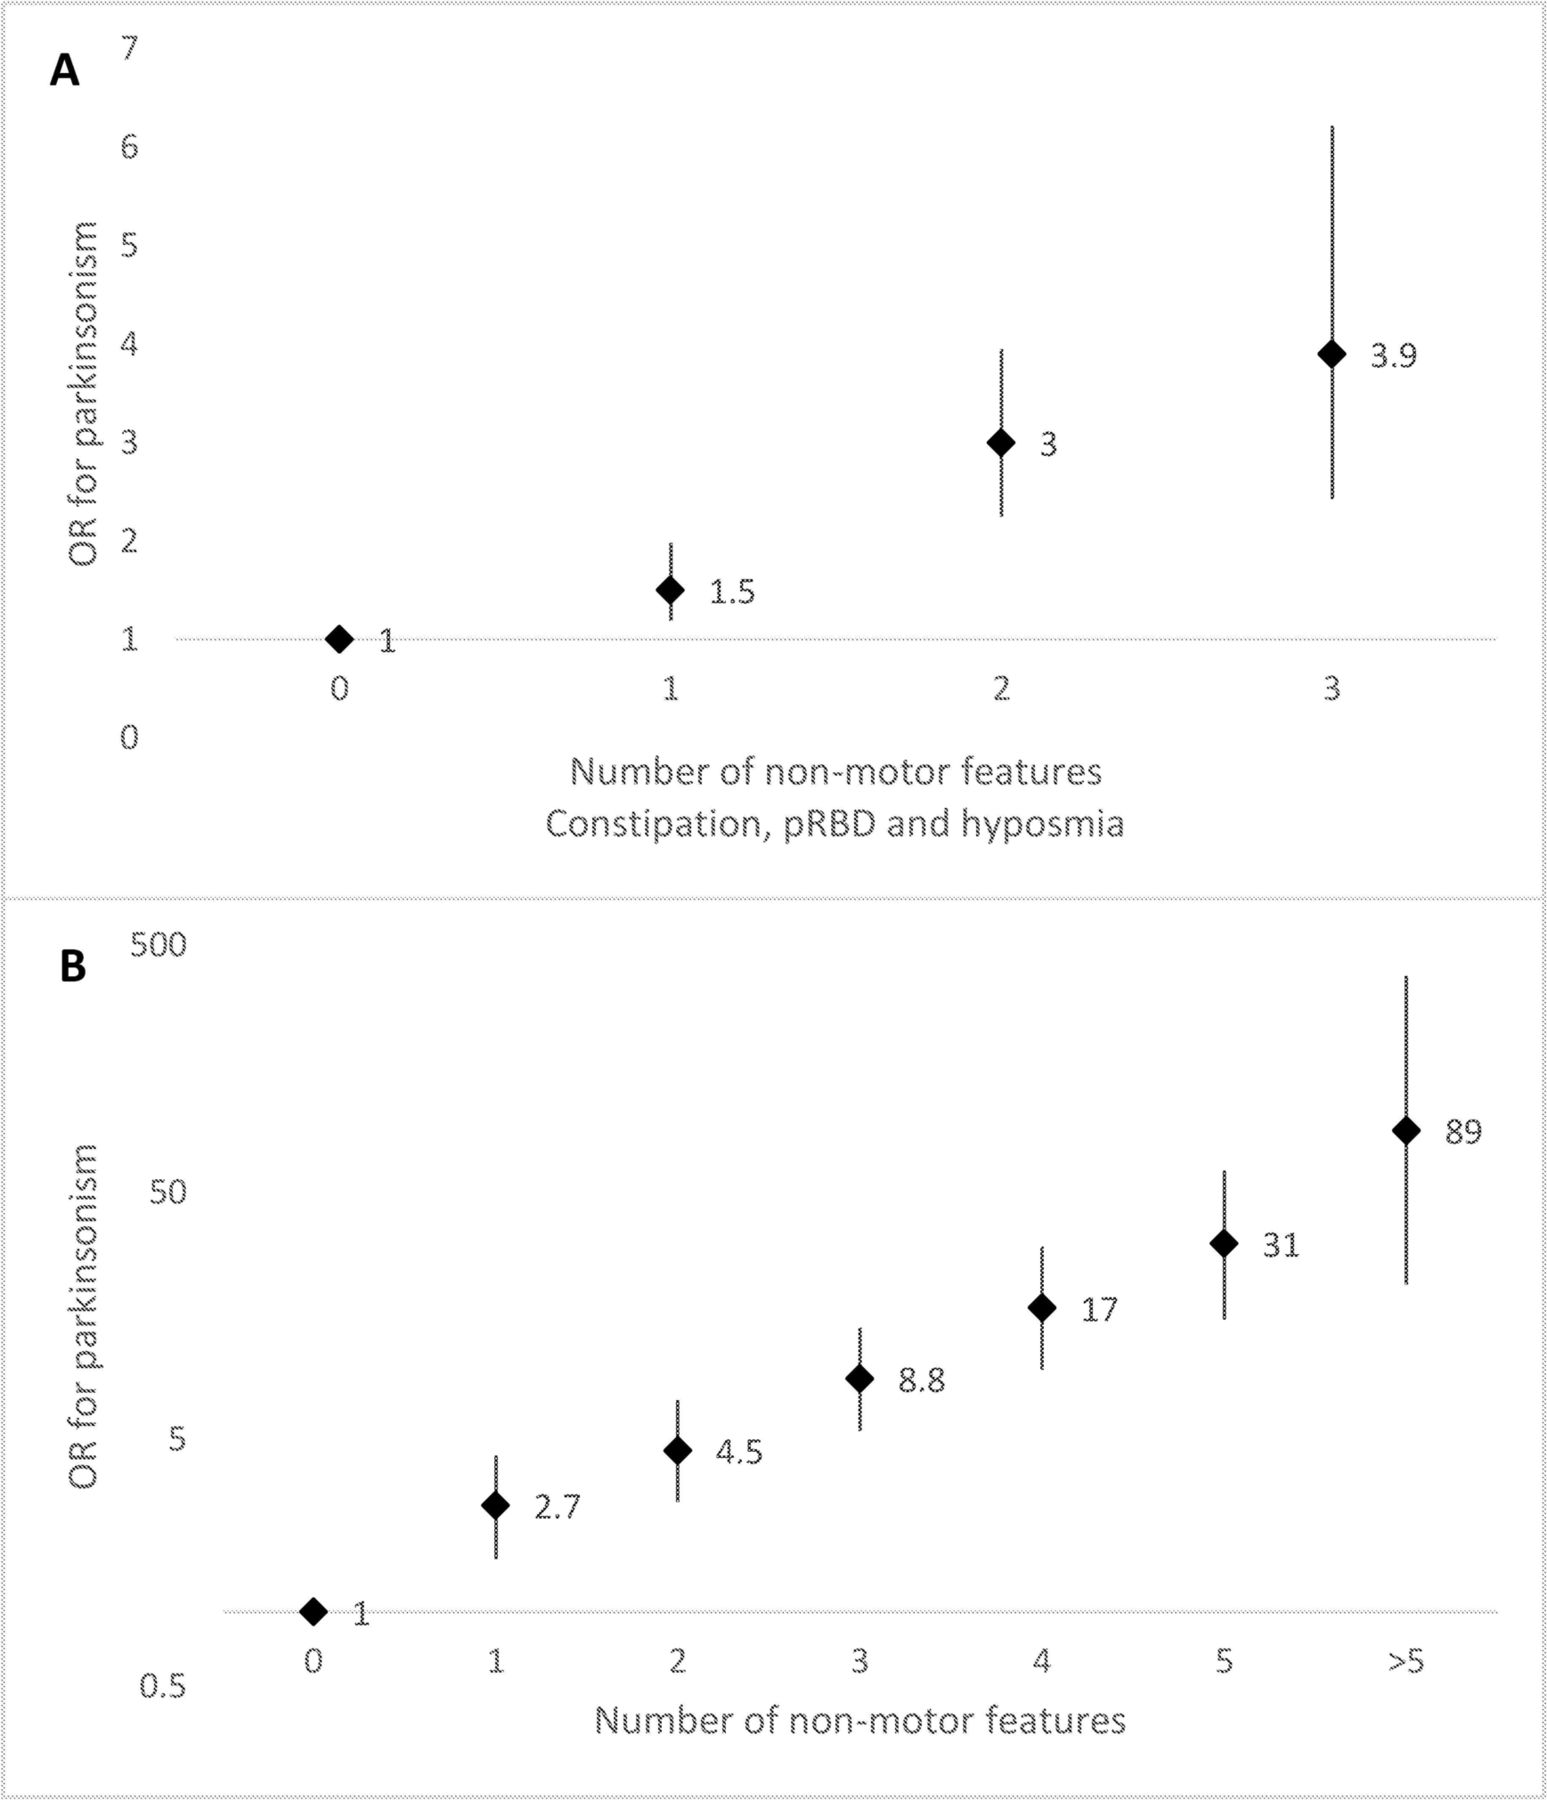
Age-adjusted associations between number of non-motor features, including (A) constipation, probable rapid eye movement sleep behaviour disorder (pRBD) and hyposmia and parkinsonism and (B) constipation, pRBD, hyposmia, impaired colour vision, depressive symptoms, excessive daytime sleepiness and body pain and parkinsonism.

ROC curve for parkinsonism using model with variable for number of non-motor features, including (A) hyposmia, pRBD and constipation (0–3) and (B) hyposmia, pRBD, constipation, excessive daytime sleepiness, impaired colour vision, body pain, and depressive symptoms (0 to ≥6). AUC, area under the curve; pRBD, probable rapid eye movement sleep behaviour disorder; ROC, receiver operating characteristic.
Discussion
In this large study of older men, we found that concurrent pRBD, hyposmia and constipation are far more common among PD cases than controls. Specifically, we found the odds of having PD were 160-fold higher among men with these signs compared with those with none. The odds of PD further increased among men with additional non-motor features; among men who had at least six non-motor features, the OR for PD was over 1000. Strong associations were seen also for parkinsonism among men without PD. These strong associations support the feasibility of sequentially screening large populations for these features to identify individuals who are likely to be in a prodromal phase of PD.
The prevalence of constipation in our cohort was comparable to that reported in previous population-based studies that used similar methods and definitions.18 In contrast, the prevalence of pRBD of 12.2% in our cohort, although identical to that reported in a study among 106 older adults in Olmsted County, Minnesota, that used the same question,10 was somewhat higher than reported in previous population-based studies that included individuals without regular bed partners—in those studies, the prevalence of pRBD ranged from 5.9% to 11.5%,20–22 probably reflecting the fact that many individuals without regular bed partners may be unaware that they are enacting dreams and, in some studies, differences in age. The demonstration of the loss of normal sleep atonia during REM sleep is considered the gold standard for RBD diagnosis.18 Although our pRBD screening was based on a previously validated question with high sensitivity and specificity for PSG-confirmed RBD in community-based studies, most individuals with pRBD fail the diagnostic standards when examined by PSG. The PPV of pRBD for PSG-confirmed RBD is, however, likely to be higher among individuals with constipation and hyposmia, which identify individuals with higher probability of having PD (and thus RBD) and can be further increased with more detailed questions that screen out individuals less likely to have RBD.23
The individual associations of hyposmia, pRBD and constipation with PD have been previously demonstrated in a few prospective studies.5 6 24 25 The results of these prospective studies support the notion that these features occur early in the disease process and may thus contribute to identify individuals at high risk of PD. None of these previous studies, however, had a sufficient sample size to estimate directly how the combination of these three features relates to PD risk. The results of our study show a strong synergism between these features, supporting their feasibility for general population screening for the identification of prodromal PD.
The other features included in our study were chosen based on previous evidence of their association with PD. Colour vision has been reported to be significantly impaired in patients with PD compared with controls,26 including among patients with early PD (≤3years since onset)27 and patients with de novo PD.28 Retinal dopamine levels have been found to be reduced in patients with PD.29 In a cohort of 62 patients with RBD, the 21 patients who developed PD during the 5-year follow-up period had significantly worse colour discrimination at baseline compared with those who remained PD free, with only minimal worsening closer to the time of disease onset.30 However, impaired colour discrimination in PD is also associated with cognitive impairment and posterior white-matter alterations.31 Performance on the Farnsworth-Munsell 100 hue test may therefore at least partly reflect cognitive impairment, which itself appears to be a sign of prodromal PD.31 32
Depression is more common in PD than in the general population,33 and several studies have documented an increased prevalence of depression in patients with PD before the clinical onset of PD.34 In a nation-wide cohort study of over 500 000 individuals in Sweden, depression was associated with a relative risk of 3.21 for PD within the first year of enrolment and attenuated but remained significant over the full 20-year follow-up period.35 Similarly, in the NIH-AARP Diet and Health Study, the OR for PD diagnosed after 2000 comparing people diagnosed in 1995–1999 to people without depression was 2.7 and was attenuated but remained significant for individuals diagnosed with depression up to at least 15years before PD diagnosis.36 Initiators of antidepressants also have an increased risk of PD, and this association is stronger during the first 2years of follow-up.37
Excessive daytime sleepiness is common in PD and appears to increase with disease duration. One study in Norway found a prevalence among patients with PD of 8% at baseline and 21% after 4years of follow-up; patients with excessive daytime sleepiness were also reported to have a more rapid decline inUPDRS-Activities of Daily Living score.38 A similar increase in excessive daytime sleepiness was found in another study among originally drug-naive patients within 5years of their diagnosis.39 In the Honolulu-Asia Ageing Study, excessive daytime sleepiness was associated with a more than threefold increased risk of PD.40
Patients with PD report experiencing significantly more pain than the general population.41 Some pain experienced by patients with PD is secondary to dystonia42; however, many patients report that pain began before their PD diagnosis had been confirmed.41 A nationwide prospective cohort study in Taiwan with a mean follow-up duration of 3 years found that pain was associated with PD risk in a dose-dependent manner; the HR for moderate to severe pain was 2.88.43
As with most other non-motor features of PD, with the possible exception of PSG-confirmed RBD,44 45 each of these signs is too common among older individuals to on its own identify prodromal PD; however, we have demonstrated that having multiple non-motor signs is far more common among PD cases than among the rest of the population. By combining several non-motor signs, it appears that a very high specificity for PD is achievable, with the expected tradeoff of a loss in sensitivity. However, longitudinal studies are necessary to better understand the timing of these signs in relation to PD onset. As reviewed above, these non-motor signs appear to occur at different times relative to PD onset; the sensitivity of individual signs, and presumably also of their combinations, would be expected to increase as neurodegeneration progresses. In addition, we found positive associations between many of the non-motor features under study; this lack of independence should be taken into account for future updates of the MDS research criteria for prodromal PD.
A major strength of our study is its size—our study was nested within a large, well-characterised cohort that comprised over 18 000 active eligible participants, and non-motor features were assessed among 120 cases and over 6000 controls. One limitation is that the results reported here are cross-sectional, so temporality cannot be determined; prospective studies will be necessary to better characterise the sensitivity, specificity and PPV of combinations of non-motor features for the diagnosis of prodromal PD. In addition, the average age of our cohort at assessment for non-motor features was 73, which is somewhat older than the average age of onset of PD,46 and all participants were male. Our results may thus not be representative of a population that progresses to PD at an earlier age, or of women. This study did not include an exhaustive assessment of putative prodromal features of PD; for example, abnormal dopaminergic positron emission tomography or single photon emission computed tomography, symptomatic hypotension, erectile dysfunction and urinary dysfunction, all included in the MDS research criteria for prodromal PD,47 were not assessed in our study. Finally, our study was conducted among health professionals with a high degree of education and interest in health, and the self-reported assessments that we employed may not perform equally well in less educated populations.
In conclusion, our results show strong associations between combinations of non-motor signs and odds of parkinsonism and PD, suggesting that low-cost screening programmes may identify individuals who have a high probability of developing PD within a few years.
References
Footnotes
Contributors KCH, XG, JMB, CS, MAS and AA contributed to data acquisition. XG, MAS and AA contributed to study concept and design. KCH, LV and AA contributed to data analysis. KCH, XG, JMB, CS, IYK, LV, MAS and AA contributed to drafting the manuscript and figures.
Funding This study was supported by Department of Defense grant W81XWH-14-0131. The HPFS cohort is funded by NIH grant UM1 CA167552.
Competing interest XG has served on committees of the Sleep Research Society, American Academy of Sleep Medicine, and Parkinson Study Group and received funding from the NIH/NINDS. MAS served on the scientific advisory board for CBD Solutions (foundation), has served as a consultant for New Beta Innovation (company) and Harvard University and is funded by NIH grants NS090259, NS098746, U13NS103523, Department of Defense W81XWH-11-1-0150, the Michael J. Fox Foundation, the Parkinson’s Alliance, the Parkinson’s Foundation and Target ALS Foundation. AA received a research grant from the Department of Defense related to this work. He has also received research grants from the National Institutes of Health, the Michael J. Fox Foundation and the National Multiple Sclerosis Society, outside of this work.
Patient consent Not required.
Ethical approval Human Research committees at the Brigham and Women's Hospital and the Harvard T. H. Chan School of Public Health.
Provenance and peer review Not commissioned; externally peer reviewed.