Article Text

Abstract
Background For many chronic conditions, lower socioeconomic status is associated with higher rates of disease. Previous research has not investigated whether this inverse relationship exists for Parkinson's disease (PD). The purpose was to investigate the association between socioeconomic status and prevalence and incidence of PD.
Methods The study was conducted using population-based administrative data from Manitoba, Canada. PD cases were identified from diagnoses in hospital and physician records. Area-level census data on average household income and residential postal codes in health insurance registration files were used to assign PD cases to urban and rural income quintiles. Annual adjusted prevalence and incidence estimates were calculated for fiscal years 1987/88–2006/07. Hypotheses about differences between quintiles in average estimates and average rates of change were tested using generalised linear models with generalised estimating equations.
Results The estimated prevalence of PD increased over the 20-year-period but incidence remained unchanged. In urban regions, average prevalence and incidence estimates were significantly higher for the lowest income quintile than the highest quintile. In rural regions, average prevalence estimates were significantly higher for the lowest quintile than for the highest quintile but incidence estimates were not significantly different. The annual rate of increase in the PD prevalence was significantly different for the lowest urban and rural income quintiles.
Conclusions There is a greater burden of PD in low-income areas. An understanding of socioeconomic inequalities is useful when formulating hypotheses about factors associated with disease onset and developing equity-oriented policies about access to healthcare resources.
- Parkinson's disease
- socioeconomic status
- administrative data
- longitudinal
- health services
- health statistics
- longitudinal studies
- socio-economic
Statistics from Altmetric.com
- Parkinson's disease
- socioeconomic status
- administrative data
- longitudinal
- health services
- health statistics
- longitudinal studies
- socio-economic
Parkinson's disease (PD) is a chronic and progressive movement disorder with an unknown aetiology. It is the second most common neurodegenerative disorder after Alzheimer's disease, and has an age of onset in middle or later years. PD can significantly impair an individual's quality of life and place a large burden on the healthcare system.1–3 To facilitate an understanding of the impact of this disease on the population, a number of investigations have been undertaken about prevalence and incidence of PD and factors associated with variations in disease rates.4–6 Recent research suggests that PD prevalence is increasing, in part due to an ageing population,6 while other studies suggest that the incidence rate has remained largely unchanged.7
For many chronic conditions, including diabetes and cancer, an inverse socioeconomic gradient exists, whereby lower socioeconomic status (SES) is associated with higher rates of disease prevalence and incidence, even after adjusting for differences in population characteristics.8 Studies about SES variations in disease rates are useful for formulating hypotheses about the role of environmental and social factors in disease onset and developing policies about equitable access to healthcare resources. To date, we have identified only two studies that have examined the association between SES and PD. Li et al9 found a weak positive association between hospitalisation rates for PD and level of education—one indicator of SES. In an investigation of vital statistics data, Pressley et al10 found that higher-income individuals were more likely to have PD recorded on the death certificate than lower-income individuals.
The aim of this study is to investigate the association between SES and both the prevalence and incidence of PD. Twenty years of data from a large population-based repository are used to conduct the research.
Methods
Study data are from the central Canadian province of Manitoba, which has a population of approximately 1.2 million. Like other Canadian provinces, Manitoba has a system of universal healthcare. More than 60% of provincial residents live in one of two major urban centres: Winnipeg (population 661 730) and Brandon (population 40 275).11 The remainder of the population is distributed across small rural communities in the southern half of the province and in remote mining and fishing communities in the northern part of the province. The north contains a high proportion of Aboriginal persons, which includes First Nations (ie, Indian), Metis and Inuit persons. The south is ethnically diverse with the majority of the population being of European descent; recent immigrants are from the Philippines, China and India. Approximately 10% of the urban population is Aboriginal compared to 22% of the rural population.
Anonymised linked administrative data, including hospital abstracts, physician billing claims and health insurance registration files, from the Manitoba Centre for Health Policy Research Data Repository were used. PD cases were identified from diagnoses in hospital and physician records. A hospital abstract is completed when a patient is discharged from an acute care facility. In Manitoba, diagnoses in hospital abstracts are recorded using the International Classification of Diseases, 9th revision, Clinical Modification (ie, ICD-9-CM) up to and including the 2003/04 fiscal year and the International Classification of Diseases, 10th revision, Canadian version (ie, ICD-10-CA) for subsequent years. As many as 16 ICD-9-CM codes and 25 ICD-10-CA codes are recorded in hospital abstracts. Physicians who are paid on a fee-for-service basis submit billing claims to the provincial health ministry; these claims capture almost all outpatient services, including those provided in hospital emergency departments and outpatient departments. Physician claims contain a single ICD-9-CM code. While some physicians are salaried (ie, about 7% of family physicians12), approximately 90% of these physicians submit parallel billing claims for administrative purposes. The accuracy and completeness of administrative data in the Research Data Repository have been described elsewhere.13
Individuals with a diagnosis for PD (ICD-9-CM 332 or ICD-10-CA G20) and who were over 25 y of age were identified as PD cases using a previously defined methodology.6 The assumption was made that a diagnosis of PD for individuals under 25 y of age may represent a coding error. Diagnoses in administrative data have been validated and used extensively in Manitoba,14–16 as well as in other jurisdictions,17 18 to ascertain cases of many chronic diseases, including PD.
Counts of the number of cases with a PD diagnosis recorded at any time during the year (ie, period prevalence) were obtained for 1987/88–2006/07. Cases in each study year were identified as incident if no previous PD diagnosis was identified in hospital or physician data. Incident cases were only identified for fiscal years 1990/91–2006/07; earlier years of data were used to define the clearance period (ie, disease-free period) for the first fiscal year.
SES was defined using a method previously developed and validated in Manitoba19 based on average household income data from the Statistics Canada Census for 1986 to 2001. Census data are collected every 5 y. Each resident's postal code, which was identified from health insurance registration files, was assigned to an enumeration area (EA), the smallest geographic area for which Census data are available prior to 2001, or a dissemination area (DA), which replaced the EA as the Census unit of geography in 2001. Income ranges were determined such that the Manitoba population was divided into five approximately equal groups. Residents were assigned an income quintile according to their EA or DA average household income. Some residents could not be assigned to a quintile; for example, postal codes in which more than 90% of the residents are in long-term care facilities are excluded because the Census does not collect income for institutionalised persons. Postal codes associated with institutions, such as prisons and mental health institutions, are excluded for this same reason. Overall, less than 2% of the study population in any given year could not be assigned to an income quintile using this methodology.
The SES methodology was applied separately to data for rural and urban regions of Manitoba; urban/rural status for an EA/DA is based on population size. The 1986 Census was used to assign urban and rural income quintiles for 1987/88 and 1988/1989, the 1991 data were used to assign quintiles for 1989/90–1993/94 and the 1996 Census was used for the assignment in 1994/95–1998/99. The 2001 Census, the most recent available, was used to assign quintiles for the remaining years.
Generalised linear models with generalised estimating equations (GEEs) were used to analyse the data.20 Counts of the number of PD cases in population strata defined by age (5-y groupings), sex, region (urban/rural), income quintile and year were modelled assuming a negative binomial distribution. This distribution was selected due to heterogeneity in case counts across the population strata.21 Model fit was assessed, under the assumption of independence of observations, using the ratio of model deviance to degrees of freedom. For well-fitting models, this ratio should be close to one. The natural logarithm of the Manitoba population in each stratum was used as an offset variable in the models. An exchangeable structure, which assumes constant correlation over time, accounted for dependence among the PD case counts.
Models containing the main effects of age group, sex, region, year and the year–sex interaction were fit to the data to estimate annual prevalence and incidence rates for males and females. Differences in average rates for income quintiles were tested for models that contained the main effects of year, region, quintile, age group, sex and the income-region interaction. Specifically, single degree of freedom contrasts22 among the regression coefficients were used to test null hypotheses about (a) no difference between the highest income quintile (Q5) and the lowest income quintile (Q1) in rural and urban areas, (b) no difference between the highest urban income quintile and highest rural quintile, and (c) no difference between the lowest urban income quintile and lowest rural quintile. A test for a linear trend across the income quintiles was also conducted. As well, separate models were defined to test differences between the highest and lowest income quintiles for males and females. Finally, a model that also included the three-way interaction among income, region and year was used to test the linear change over time for income quintiles; exponentiation of the regression coefficients for the interaction is used to provide an estimate of the annual relative rate (RR) of change for rural and urban quintiles. The contrast and linear trend statistics asymptotically follow a χ2 distribution. All analyses were performed using the GENMOD procedure in SAS.23 A significance level of α=0.05 was adopted.
Ethics approval was received from the University of Manitoba Health Research Ethics Board. Approval for data access was granted by the Health Information Privacy Committee of Manitoba Health.
Results
The total number of PD cases ascertained from diagnoses in hospital and physician data rose from 3062 in 1987/88 to 5103 in 2006/07—an increase of 66.6%. The percentage of cases identified solely from physician billing claims increased over time, from 43.4% in the first year to 76.4% in the last year of the study period, while the percentage of cases identified in both hospital and physician data decreased, from 52.1% to 19.4%. Over the entire study period, 3.8% of cases in the lowest income quintile and 4.2% of the cases in the highest quintile were identified only in hospital data. Furthermore, 36.8% of the cases in the lowest income quintile and 36.0% of the cases in the highest income quintile were identified in both hospital and physician data.
The trend in the age-adjusted prevalence of PD for males and females in the population over 25 y of age is shown in figure 1. For males, prevalence increased from 257.3 (95% CI 234.4 to 282.5) per 100 000 in 1987/88 to 503.8 (95% CI 470.9 to 539.0) per 100 000 in 2006/07. For females, prevalence increased from 205.9 (95% CI 186.3 to 228.4) per 100 000 in 1987/88 to 392.9 (95% CI 365.6 to 422.1) per 100 000 in 2006/07.

Age-adjusted prevalence and incidence of Parkinson's disease (PD) for the population of Manitoba, Canada, over 25 y of age.
The total number of incident cases remained relatively constant, ranging from 601 in 1990/91 to 560 in 2006/07 (figure 1). In 1990/91, the age-adjusted incidence rate was 81.8 (95% CI 68.0 to 98.4) per 100 000 for males and 60.2 (95% CI 49.6 to 73.2) per 100 000 for females. In 2006/07, the adjusted rate was 102.3 (95% CI 88.5 to 118.2) per 100 000 for males and 63.4 (95% CI 54.9 to 73.1) per 100 000.
Average adjusted prevalence rates by income quintile are reported in table 1, along with tests of the difference between the lowest and highest quintiles and the linear trend. While the Q1:Q5 ratio was larger for urban than rural quintiles, the difference between the two quintiles was statistically significant in both regions, as was the linear trend. The ratio of prevalence estimates for the lowest and highest quintiles was the same for urban males and females (Q1:Q5=1.5), but was slightly larger for rural females than rural males. The sex-specific contrast tests for the quintiles were statistically significant, as were the linear trend tests. Further analyses revealed no statistically significant difference between the average prevalence estimates for the lowest urban and rural income quintiles (p=0.631), but there was a significant difference between the highest urban and rural income quintiles (p=0.034). The latter finding was also observed for both males (p<0.001) and females (p=0.047).
Model-based adjusted average prevalence and incidence of Parkinson's disease (95% CIs) by income quintile for the Manitoba population over 25 y of age
For the average incidence estimates (table 1), the Q1:Q5 ratio for the urban region was the same magnitude as for prevalence, but for the rural region it was smaller (ie, Q1:Q5=1.1) and the contrast test was not statistically significant. However, the test of linear trend was statistically significant for the rural region. The contrast and linear trend tests for incidence estimates were statistically significant for urban males and females, but for rural regions only the linear trend test was significant for females. Further analyses revealed that overall, the difference between the lowest urban and rural income quintiles was not statistically significant (p=0.099). This difference was significant for males (p=0.016), but not for females (p=0.894). The difference between the highest urban and rural income quintiles was not statistically significant for either males (p=0.842) or females (p=0.079).
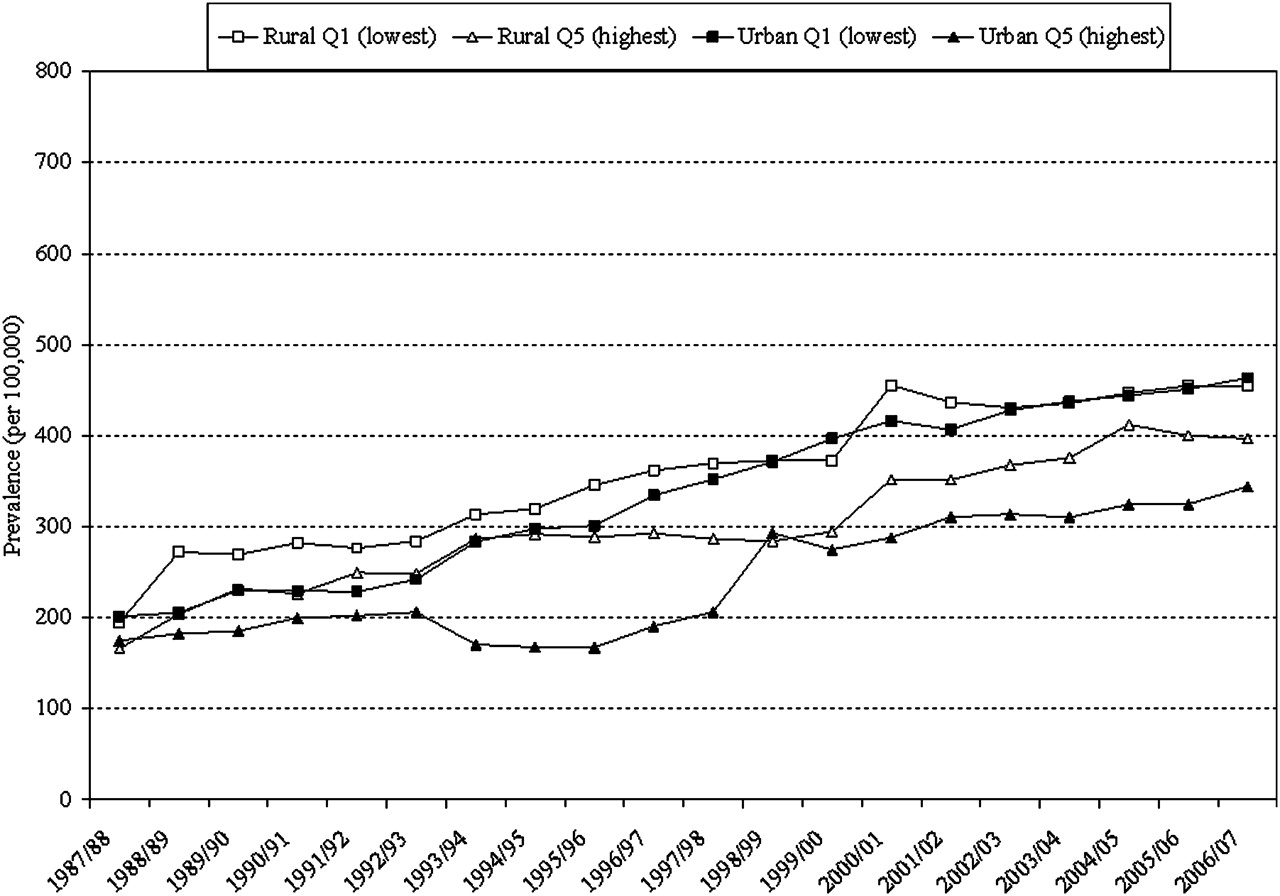
Annual adjusted prevalence estimates are reported for the lowest and highest urban and rural income quintiles in figure 2. Prevalence estimates in the first year of the study period ranged from 166.1 (95% CI 124.5 to 221.5) for the highest rural income quintile to 201.1 (95% CI 176.7 to 229.9) for the lowest urban income quintile and from 344.1 (95% CI 302.1 to 391.8) to 463.4 (95% CI 417.0 to 515.0) for the highest and lowest urban income quintiles, respectively, in the last year. The RRs (table 2) were significantly different for the lowest income quintiles in the urban and rural regions (p=0.003). The RR was not significantly different for the lowest and highest urban income quintiles (p=0.757) or rural income quintiles (p=0.909).

Age- and sex-adjusted prevalence estimates of Parkinson's disease (PD) for the population of Manitoba, Canada, over 25 years of age for the lowest (Q1) and highest (Q5) income quintiles.
Age- and sex-adjusted annual relative rate (RR) of change in prevalence of Parkinson's disease (95% CIs) by income quintile for the Manitoba population over 25 y of age
Discussion
This study revealed an inverse association between SES for both prevalence and incidence of PD. Prevalence rates were higher in lower than in higher income quintiles in both rural and urban regions, and incidence rates were higher in the lowest urban income quintile than the highest urban income quintile. Tests of a linear trend across quintiles were significant for both urban and rural quintiles. This study also showed that the prevalence of PD increased over time and the relative rate of increase was significantly greater in the lowest income groups in urban and rural regions, although the magnitude of this difference was small.
Age-specific prevalence estimates from this study were compared to the estimates from three North American studies that also used administrative data to estimate PD prevalence. Estimates from the western Canadian province of Alberta in the early 1980s were higher than those produced using Manitoba data in the same time period,24 while the estimates from eastern Canada in a later time period were lower.6 Svenson25 found substantial geographic variation in rates of PD in Canada, with lower rates in the east than in the west. Noyes et al26 obtained estimates ranging from 2086–2556 per 100 000 for the 65+ population in the period 1992–2000; in Manitoba for this same time period the estimate was 2362 per 100 000.
Evidence of increasing PD prevalence was recently reported in another Canadian jurisdiction.6 The finding of a relatively stable incidence rate is consistent with previous research.7 One potential explanation for these findings is a decline in disease-related mortality, particularly in younger age groups.27 Another potential explanation is earlier diagnosis, because the disease is better recognised by physicians and patients. However, Twelves et al7 cautions about the methodological difficulties associated with estimating the incidence of PD and the effect that this may have on the comparability of results from different studies or over time.
Support for the finding of an inverse association between SES and rates of PD comes from research that has shown PD to be more common in some occupational groups than in others, possibly due to exposure to environmental contaminants.9 28 29 At the same time, smoking, which tends to be more common in lower socioeconomic groups, has been shown to be a protective factor for PD.30 It is difficult to disentangle the effects of occupation and smoking on health.31 While it is acknowledged that genetic and environmental factors contribute to PD, there is no consensus about the relative contributions of different risk and protective factors.
Previous studies have reported higher prevalence in rural than in urban areas24; one explanation is greater exposure to environmental contaminants, such as pesticides, in rural regions.32 In the current study, while estimates were higher in rural than in urban regions in the highest income quintile, there was no difference between urban and rural regions in the lowest income quintile.
This research has some limitations. Diagnosis codes in administrative data were used to identify PD cases; some cases may not have a diagnosis recorded in administrative data, the date of disease onset can only be approximated from the date of the first diagnosis and there is the potential for misclassification of cases. Noyes et al18 found that while the specificity of administrative data for ascertaining cases of PD was very high (eg, greater than 99%), sensitivity was low (eg, about 66%), suggesting that there may be under-ascertainment of the disease in administrative data. Swarztrauber et al33 observed the difficulty of distinguishing cases of parkinsonism and PD in administrative data. In Canada, physician data may be of poorer quality than hospital data for case ascertainment because the accuracy of diagnostic coding is not linked to physician remuneration.34 However, misclassification of disease cases may be less likely when specialists (eg, neurologists) report the diagnosis.
Li et al9 found a weak association between PD hospitalisation rates and level of education. However in the current study, the percentage of cases identified from hospital and physician data was the same in both the highest and lowest quintiles. Differences between the studies may reflect differences in the measurement of SES. Our findings suggest that the effect of misclassification is unlikely to have a differential effect across income quintiles. Moreover, in a set of follow-up analyses for a cohort of PD cases attending the Manitoba Movement Disorders Clinic, which is staffed by neurologists, we found similar percentages of cases in the highest (19.8%) and lowest (22.2%) income quintiles, suggesting that both groups are equally likely to have a specialist diagnosis.
In some studies, prescription drug data have been used in addition to hospital and physician data to improve the sensitivity of administrative data for ascertaining PD cases.35 36 This methodology was not adopted in the current study because prescription data are only available from fiscal year 1995/96 onward and preliminary analyses revealed substantially higher rates of PD than have been reported previously using administrative data,6 suggesting the need for further validation of this case ascertainment method.
Where an individual is living at the time of diagnosis may not correspond with where that individual has lived his or her life, particularly in older populations. However, a recent study in Alberta, Canada, investigated the potential role of residential mobility in explaining geographic variations in the prevalence of PD.37 While persons diagnosed with PD were more likely to move than healthy controls, most changes in residence occurred within small areas (ie, municipalities) and, therefore, the effect of mobility on geographic variations in prevalence was small. Finally, the income quintile methodology adopted in this study uses a small-area measure of average household income to assign individuals to income groups; individual-level and/or household-level measures of income are not available due to data privacy restrictions. However, a validation study conduced in Manitoba38 found that the use of an area-level instead of an individual-level measure did not attenuate the association between SES and health.
The advantages of the methodology adopted are that the data cover a well-defined population of sufficient size to be able to ascertain cases of this relatively rare condition. As well, administrative data are not subject to referral bias, which is likely to affect the results of studies that use data from specific clinics and/or geographic areas to examine the association between SES and PD.9 24
In summary, an inverse association was observed between an area-level measure of income and rates of PD in one Canadian province. Further research might investigate environmental or social factors associated with these socioeconomic variations. For example, in Manitoba, a recent ecological investigation found an association between pesticide use in rural areas and rates of health service utilisation for a number of chronic conditions; this research could be extended to include PD.39 An inverse association has been observed between SES and healthcare use, even in jurisdictions with universal health care.19 Investigations about access to healthcare resources and the association between access and health outcomes40 also provide an opportunity for further research.
What is already known on this topic
Previous research suggests the prevalence of Parkinson's disease (PD) is increasing, in part due to population ageing. There is also evidence that prevalence rates are higher in rural areas and in some occupational groups.
PD is associated with a significant increase in healthcare resource use.
What this study adds
Our study demonstrates an inverse association between an area-level measure of socioeconomic status and both prevalence and incidence of Parkinson's disease (PD) as ascertained from diagnoses in administrative data.
A socioeconomic gradient in prevalence and incidence was evident for income groups in urban regions, but was less apparent in rural regions.
The results lend support to the hypothesis that environmental factors may contribute to disease onset and suggest a further need to investigate equitable access to health care across income groups for individuals with PD.
Acknowledgments
The authors are indebted to Manitoba Health for the provision of data (#2007/08-25). The results and conclusions are those of the authors and no official endorsement by Manitoba Health is intended or should be inferred.
References
Footnotes
Funding This research was supported by funding from the National Parkinson's Foundation to the research team and a Canadian Institutes of Health Research New Investigator Award to the first author.
Competing interests None.
Ethics approval This study was conducted with the approval of the University of Manitoba Health Research Ethics Board.
Provenance and peer review Not commissioned; externally peer reviewed.