Article Text

Abstract
Introduction We studied a registry of Emergency Medical Systems (EMS) identified prehospital suspected stroke patients brought to an academic endovascular capable hospital over 1 year to assess the prevalence of disease and externally validate large vessel occlusion (LVO) stroke prediction scales with a focus on predictive values.
Methods All patients had last known well times within 6 hours and a positive prehospital Cincinnati Prehospital Stroke Scale. LVO prediction scale scores were retrospectively calculated from emergency department arrival National Institutes of Health Stroke Scale scores. Final diagnoses were determined by chart review. Prevalence and diagnostic performance statistics were calculated. We prespecified analyses to identify scale thresholds with positive predictive values (PPVs) ≥80% and negative predictive values (NPVs) ≥95%. A secondary analysis identified thresholds with PPVs ≥50%.
Results Of 220 EMS transported patients, 13.6% had LVO stroke, 15.9% had intracranial haemorrhage, 20.5% had non-LVO stroke and 50% had stroke mimic diagnoses. LVO stroke prevalence was 15.8% among the 184 diagnostic performance study eligible patients. Only Field Assessment Stroke Triage for Emergency Destination (FAST-ED) ≥7 had a PPV ≥80%, but this threshold missed 83% of LVO strokes. FAST-ED ≥6, Prehospital Acute Severity Scale =3 and Rapid Arterial oCclusion Evaluation ≥7 had PPVs ≥50% but sensitivities were <50%. Several standard and lower alternative scale thresholds achieved NPVs ≥95%, but false positives were common.
Conclusions Diagnostic performance tradeoffs of LVO prediction scales limited their ability to achieve high PPVs without missing most LVO strokes. Multiple scales provided high NPV thresholds, but these were associated with many false positives.
- STROKE
Data availability statement
Data are available upon reasonable request.
This is an open access article distributed in accordance with the Creative Commons Attribution Non Commercial (CC BY-NC 4.0) license, which permits others to distribute, remix, adapt, build upon this work non-commercially, and license their derivative works on different terms, provided the original work is properly cited, appropriate credit is given, any changes made indicated, and the use is non-commercial. See: http://creativecommons.org/licenses/by-nc/4.0/.
Statistics from Altmetric.com
WHAT IS ALREADY KNOWN ON THIS TOPIC
The prevalence of large vessel occlusion (LVO) stroke among prehospital suspected stroke patients is not well characterised and affects the positive and negative predictive values (PPVs and NPVs) of the LVO predictions scales used for prehospital triage to endovascular stroke centres.
WHAT THIS STUDY ADDS
The prevalence of LVO stroke among Emergency Medical Services transported suspected stroke patients was low at 13.6%. Using higher than standard LVO prediction scale thresholds or including intracranial haemorrhages as true positives enabled some scales to reach PPVs ≥50% but false negatives were common. NPVs ≥95% were achieved by several standard and lower than standard score thresholds but false positives were common.
HOW THIS STUDY MIGHT AFFECT RESEARCH, PRACTICE AND/OR POLICY
Future prehospital triage studies will need to account for the low prevalence of LVO stroke and currently available LVO predictions scales are more capable of providing high NPVs than PPVs.
Introduction
Endovascular therapy (EVT) for large vessel occlusion (LVO) stroke is highly effective and time-dependent.1 LVO prediction scales use neurological examination findings to identify LVO stroke patients in the prehospital setting and can facilitate their triage directly to EVT centres. This is intended to avoid the EVT treatment delays and worse outcomes associated with initial transportation to a non-EVT centre followed by an interfacility transfer to an EVT centre.2–5 Most scales assign points based on the absence, presence or gradations of severity of examination findings and provide either a binary positive or negative result or a total score. LVO prediction scales that provide total scores each have a standard scale score threshold, often suggested by the researchers who created the scale, that is typically used to declare it positive or negative. Importantly, alternative lower score thresholds can be used as more sensitive but less specific LVO stroke prediction tests. Conversely, higher score thresholds can serve as less sensitive but more specific tests.
The positive predictive values (PPVs) and negative predictive values (NPVs) of LVO prediction scales are of particular interest to Emergency Medical Service (EMS) providers because they allow for the interpretation of an individual patient’s post-test probability of having an LVO stroke. This is in contrast with sensitivity and specificity, which provide evaluations of a test’s performance among all of those known to have LVO stroke (sensitivity) or all those known to not have LVO stroke (specificity).6 7 All four parameters are important, but predictive values are highly dependent on the prevalence of the target disease in the sample of patients tested.7 8 If the prevalence of LVO stroke in a sample is not similar to the actual prevalence among prehospital suspected stroke patients where the test will be used, the predictive values could be dramatically inaccurate.7 9
We set out to retrospectively characterise the prevalence of LVO stroke and other final diagnoses among patients in a prehospital suspected stroke registry. Recent prehospital LVO prediction scale validation studies have focused on standard thresholds and reported PPVs under 40%, suggesting that most patients identified for triage to EVT centres using standard score thresholds will not have LVO stroke.10 11 We assessed the diagnostic performance of both standard and alternative (higher or lower) LVO prediction scale thresholds, with an emphasis on identifying thresholds that met high PPV or NPV goals, through a retrospective study of emergency department (ED) arrival National Institutes of Health Stroke Scale (NIHSS) subitem scores.
Methods
Subjects and setting
We studied consecutive suspected stroke patients transported by prehospital EMS as prehospital stroke codes to Zuckerberg San Francisco General Hospital and Trauma Center (ZSFG) between July 2017 and July 2018. ZSFG is an academic county hospital affiliated with the University of California, San Francisco. ZSFG is a Joint Commission certified Primary Stroke Center with full EVT capabilities available 24/7. As a safety net hospital, it provides healthcare for patients regardless of whether or not they have insurance. At the time of this study, there were three EVT capable Primary Stroke Centers (including ZSFG) in San Francisco plus an additional four Primary Stroke Centers without EVT capabilities. However, EMS policies required transportation of all suspected acute stroke patients with positive Cincinnati Prehospital Stroke Scales (CPSS) to the closest stroke centre regardless of EVT capabilities. The San Francisco Fire Department provides EMS transportation for approximately 75 000 patients per year, including 80% of prehospital stroke alert patients. Two private ambulance companies that are also independent of ZSFG contribute as well.
ZSFG patients were retrospectively identified for this study through the prospective Mission Protocol stroke code registry. The Mission Protocol is a quality improvement endeavour at ZSFG to expedite EMS suspected stroke evaluation and treatment.12 ED nurses at ZSFG would activate the Mission Protocol if the EMS prehospital alert call included suspected stroke, a positive CPSS and a last known well (LKW) time within 6 hours. This prompted a special stroke code activation prior to patient arrival to coordinate efforts between ED providers, neurology and radiology. All adult prehospital stroke code Mission Protocol patients transported by ambulance during the study period were included in the final diagnosis prevalence study. Patients were excluded from the LVO prediction scale diagnostic performance study if the subitems of the arrival NIHSS were not documented.
Patient demographic and clinical characteristics
We ascertained patient demographic and clinical characteristics through chart review. Times between arrival, imaging and treatment were documented using electronic medical record and radiology timestamps. Alteplase administration times were captured from clinical documentation. Whether or not the patient was intubated at the time of initial imaging was determined by review of scout and axial neuroimaging. The sample size was determined by the number of Mission Protocol stroke codes that occurred from July 2017 to July 2018. Study data were collected and managed using REDCap (Research Electronic Data Capture) hosted at the University of California, San Francisco.13 14
Index tests
The stroke code neurologist performed a NIHSS examination on ED arrival, typically before imaging, and documented the subitem scores in the medical record. LVO prediction scale scores were retrospectively calculated from the arrival NIHSS subitems using if/then formulas written in StataSE V.16 (Stata Statistical Software: Release 16. StataCorp, College Station, Texas, USA). The LVO prediction scales tested included asymmetric arm weakness (AAW), interval (0–3) scoring of the CPSS, Cincinnati Stroke Triage Assessment Tool (C-STAT), Field Assessment Stroke Triage for Emergency Destination (FAST-ED), Gaze-Face-Arm-Speech-Time (G-FAST), Modified National Institutes of Health Stroke Scale (mNIHSS), NIHSS, Prehospital Acute Severity Scale (PASS), Rapid Arterial oCclusion Evaluation (RACE), Speech Arm Vision Eyes (SAVE) and Vision Aphasia Neglect (VAN).9 15–23 LVO prediction scales that could not be calculated from the NIHSS were excluded. We prespecified comparisons of standard score thresholds from each scale’s publication or the American Heart Association’s prediction instrument review, as well as comparisons of alternative (lower and higher) thresholds.20 The LVO prediction scale scores, except for FAST-ED, were not available to the NIHSS performers as they were retrospectively calculated. FAST-ED was intermittently scored prospectively by ED providers as part of their Mission Protocol assessment and may have been reported to neurologists. We did not study these prospective FAST-ED assessments as the scores were documented in only a small minority of cases.
Reference standard
Final diagnosis of LVO stroke was the reference standard for the primary diagnostic performance study. This was determined by a retrospective review of all available chart and imaging information by a vascular neurologist (KJK) prior to calculating LVO prediction scale scores. LVO stroke was defined as acute neurological symptoms attributed to an occlusion of the internal carotid artery (ICA), the first segment of the middle cerebral artery (M1), the second segment of the middle cerebral artery (M2) or basilar arteries on acute neurovascular imaging. Involvement of these vessels was prespecified as the definition of LVO stroke due to their candidacy for EVT in clinical practice. Stroke code acute neurovascular imaging included non-contrast CT and CT angiography (CTA), though CTA could be deferred by the clinical stroke code neurologist. Final diagnosis was chosen as the reference standard instead of acute vascular imaging results to avoid the spectrum bias that would accompany excluding patients without vascular imaging, since it is often deferred in patients with intracranial haemorrhage or low suspicion for LVO stroke. We performed exploratory analyses where the definition of LVO stroke was modified to exclude M2 occlusions as well as separate analyses where intracranial haemorrhage and LVO stroke (with or without M2 occlusions) were combined into a single reference standard.
Analysis
Final diagnosis prevalences were calculated. Diagnostic performance statistics including PPV, NPV, sensitivity, specificity, positive likelihood ratios (PLR) and negative likelihood ratios (NLR) with 95% CIs were calculated for each reference standard of LVO stroke. We specified PPV and NPV goals after the prevalence data were available but prior to the diagnostic performance study. A PPV goal of ≥80% was prespecified to identify LVO scale thresholds that greatly increased the post-test probability of LVO stroke. We also performed a secondary analysis to identify scale thresholds that achieved PPVs ≥50% because the primary analysis PPV goal was only met by one scale threshold. We chose ≥50% to ensure that positive tests would be equally or more likely to be LVO than not. If multiple thresholds in the same scale met these goals, the threshold with the highest NPV was chosen to minimise false negatives.
We also prespecified an assessment for LVO prediction scale thresholds with NPVs ≥95%. This can also be expressed as a post negative test probability of LVO stroke ≤5% and was intended to identify scale thresholds that reduce the risk of missing LVO strokes. Five per cent was thought to be a meaningful reduction of the pre-test probability of LVO stroke of only ~13.6% observed in our prevalence study. If multiple thresholds of the same scale met these criteria, the threshold with the highest simultaneous PPV was selected to minimise false positives. This was repeated for the exploratory analysis that excluded M2 occlusions from the definition of LVO stroke or included intracranial haemorrhage along with LVO stroke in the reference standard.
Results
Figure 1 provides a flow diagram of participants for the prevalence and diagnostic performance studies with LVO stroke as the reference standard. Two hundred and twenty of the 236 patients in the Mission Protocol registry met the prevalence study inclusion criteria during the study time period.
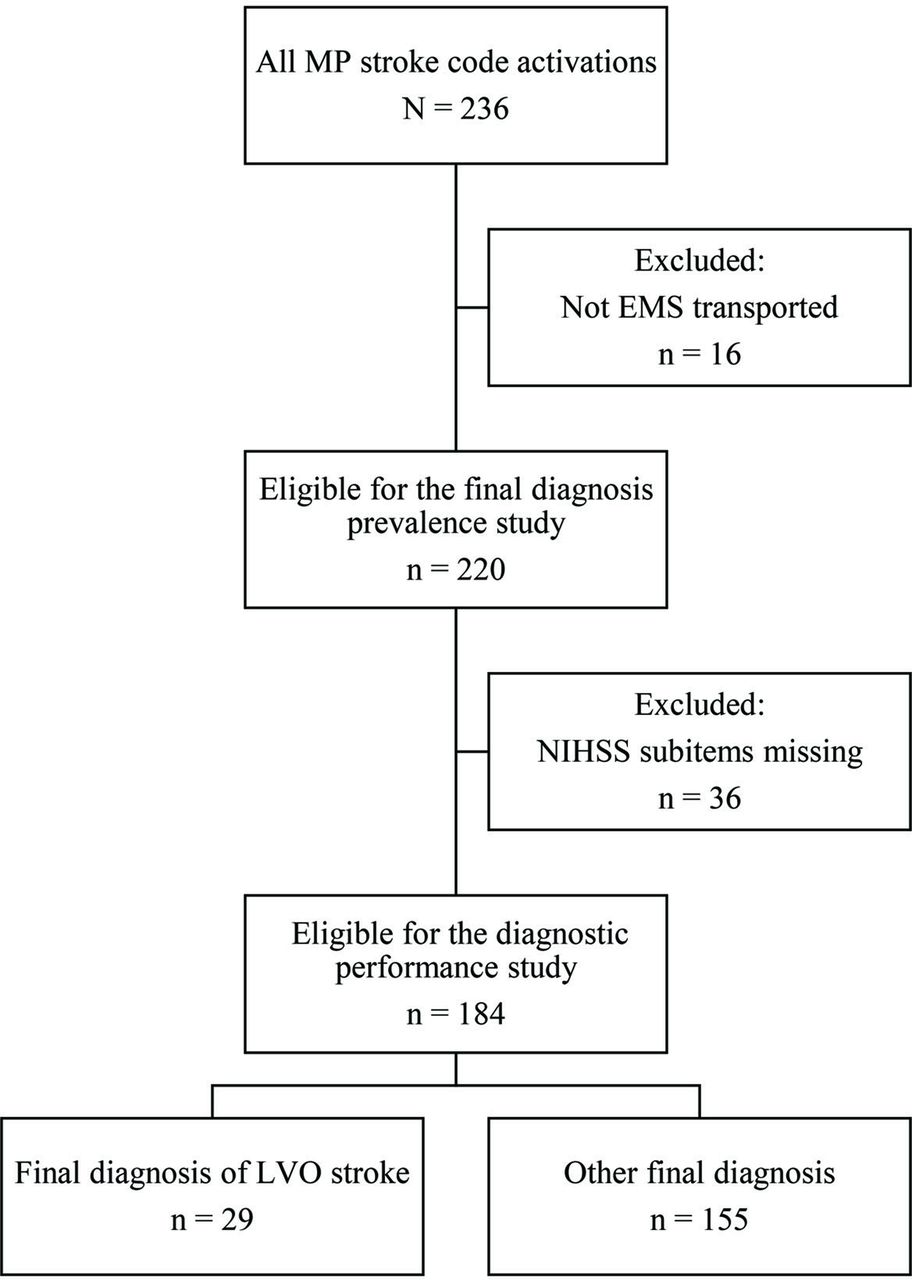
Participant flow diagram for the LVO stroke primary reference standard. EMS, emergency medical services; LVO, large vessel occlusion; MP, Mission Protocol; NIHSS, National Institutes of Health Stroke Scale.
Disease prevalence study
Stroke mimic was the most common final diagnosis category at 50% (table 1). Seizure without status epilepticus was the most common stroke mimic diagnosis but accounted for only 20% of all mimics. Detailed mimic final diagnoses are reported in online supplemental table 1. Non-LVO stroke was the second most common final diagnosis (20.5%), followed by intracranial haemorrhage (15.9%). LVO stroke was the least common final diagnosis at 13.6%.
Supplemental material
Final diagnoses and participant characteristics in the prevalence and diagnostic performance studies
Of the 30 patients with LVO stroke, there were 7 M1 occlusions, 1 ICA ‘T’ occlusion, 4 tandem extracranial ICA and M1 occlusions, 3 tandem intracranial ICA/M1 occlusions, 10 M2 occlusions, 1 extracranial ICA/M2 occlusion, 1 tandem extracranial ICA and second segment of the posterior cerebral artery (P2) occlusion, 2 basilar occlusions and 1 extracranial and intracranial ICA occlusion with the ipsilateral middle cerebral artery filled by the posterior communicating artery. The patient with ICA/P2 occlusions was excluded from the diagnostic performance study due to the absence of NIHSS subitem documentation (table 1). Baseline patient demographic, clinical and imaging characteristics for patients in both the prevalence study and diagnostic performance study are provided in table 1 and described in additional detail in the online supplemental file.
Diagnostic performance study
The prevalence of LVO stroke was 15.8% in the diagnostic performance study (table 1) because patients without arrival NIHSS subitem documentation were excluded. While this was rare for LVO stroke patients (1/30, 3.3%), it was notably common for intracranial haemorrhage patients (16/35, 45%).
Table 2 provides the diagnostic performance statistics of standard and alternative LVO scale thresholds when predicting the final diagnosis of LVO stroke and alternative (higher or lower) thresholds selected by positive and negative predictive value goals. As expected, PPVs and NPVs were inversely related. Higher sensitivities were also associated with lower specificities, except for FAST-ED ≥4, which was 79% sensitive and specific. CIs were wide, often exceeding a 20% range and sometimes exceeding a 30% range.
Diagnostic performance statistics for LVO stroke (ICA, M1, M2 or basilar occlusions) including standard and alternative scale thresholds that meet PPV and NPV goals
None of the standard thresholds met the prespecified PPV ≥80% goal or the secondary ≥50% goal for LVO stroke. FAST-ED ≥7 was the only alternative scale threshold identified by the prespecified analysis searching for PPVs ≥80%; however, this threshold missed 83% of LVO strokes. Alternative scale thresholds of FAST-ED ≥6, PASS =3 and RACE ≥7 met the less stringent goal of PPV ≥50% but were associated with sensitivities less than 50% (28%, 48% and 41%, respectively).
Several standard thresholds (FAST-ED ≥4, NIHSS ≥6, SAVE ≥2 and a positive VAN test) and alternative thresholds (CPSS ≥2, G-FAST ≥2, mNIHSS ≥2 and RACE ≥3) met the prespecified NPV ≥95% goal. Except for FAST-ED ≥4 (PPV 42%), these were all associated with PPVs of 30% or lower (table 2). Scale thresholds that met the high PPV goals had many false negatives. Thresholds that met the high NPV goals had many false positives. The diagnostic statistics for the reference standards of LVO stroke excluding M2s, LVO stroke excluding M2s and intracranial haemorrhage, and LVO stroke and intracranial haemorrhage are provided in online supplemental tables 2–4.
Figure 2 shows the counts of true positives, false negatives, false positives and true negatives for standard LVO prediction scale thresholds with all four studied reference standards. The most restrictive reference standard, LVO stroke without M2s (figure 2, top left), demonstrates that many standard scale thresholds can be sensitive for ICA, M1 and basilar occlusions. Including M2s in the definition of LVO stoke (figure 2, top right), which was our prespecified primary analysis, resulted in comparatively more false negatives and therefore reduced sensitivities and NPVs. However, the addition of M2s increased PPVs and very modestly increased specificities (table 2 and online supplemental table 2). The number of true positives and false negatives increased when intracranial haemorrhage was added to the reference standard (figure 2, bottom left and bottom right), while false positives decreased.

True positive, false negative, false positive and true negative classification counts for standard scale thresholds for the four reference standards. AAW +, asymmetric arm weakness positive; CPSS, Cincinnati Prehospital Stroke Scale; C-STAT, Cincinnati Stroke Triage Assessment Tool; FAST-ED, Field Assessment Stroke Triage for Emergency Destination; G-FAST, Gaze-Face-Arm-Speech-Time; LVO, large vessel occlusion; M2, second division of the middle cerebral artery; mNIHSS, modified National Institutes of Health Stroke Scale; NIHSS, National Institutes of Health Stroke Scale; PASS, Prehospital Acute Severity Scale; RACE, Rapid Arterial oCclusion Evaluation; SAVE, Speech Arm Vision Eyes; VAN +, Vision Aphasia Neglect positive; #, number.
LVO prediction scale thresholds that met our prespecified PPV and NPV goals are shown in figure 3. As the reference standard changed from the most restrictive (LVO stroke excluding M2s) to the most inclusive (LVO stroke including M2s and intracranial haemorrhage), more scales were able to provide thresholds with PPVs ≥50% including several standard thresholds (CPSS =3, C-STAT ≥2, FAST-ED ≥4 and RACE ≥5), though higher alternative thresholds were common. Conversely, the list of scale thresholds that could reach the NPV ≥95% goal was the longest for LVO stroke excluding M2s. Higher alternative thresholds were predominant though a few standard thresholds (CPSS =3, G-FAST ≥3 and VAN +) met this goal. The list of thresholds with NPVs ≥95% was shortest for LVO stroke and intracranial haemorrhage and required very low alternative thresholds that would generate many false positives (figure 3 and online supplemental tables 2–4). Two-by-two tables for each scale threshold and reference standard along with true positive, true false negative, false positive and true negative counts receiver operating characteristic curves are provided in online supplemental tables 5–8 and online supplemental figures 1–4, respectively. Receiver operating characteristic curves and scale areas under the curve (AUCs) for each reference standard are provided in online supplemental figures 5–8. AUCs were generally similar between scales, increased with the exclusion of M2s and decreased with the addition of intracranial haemorrhages.

Classification counts for standard or alternative scale thresholds that met positive and negative predictive value goals for the four reference standards. AAW +, asymmetric arm weakness positive; CPSS, Cincinnati Prehospital Stroke Scale; C-STAT, Cincinnati Stroke Triage Assessment Tool; FAST-ED, Field Assessment Stroke Triage for Emergency Destination; G-FAST, Gaze-Face-Arm-Speech-Time; LVO, large vessel occlusion; M2, second division of the middle cerebral artery; mNIHSS, modified National Institutes of Health Stroke Scale; NIHSS, National Institutes of Health Stroke Scale; PASS, Prehospital Acute Severity Scale; RACE, Rapid Arterial oCclusion Evaluation; SAVE, Speech Arm Vision Eyes; VAN +, Vision Aphasia Neglect positive; #, number.
Discussion
The American Heart Association/American Stroke Association (AHA/ASA) identified the relative lack of prehospital suspected stroke disease prevalence data as a major research limitation affecting LVO prediction scale assessments.20 We found that among 220 EMS suspected stroke patients who were prehospital CPSS positive and had LKW times within 6 hours, the most common final diagnosis category was stroke mimic (50%), followed by non-LVO ischaemic stroke (20.5%), intracranial haemorrhage (15.9%) and LVO stroke (13.6%). This distribution is similar to other studies that assessed prehospital suspected stroke patients without excluding significant subgroups. Taken all together, prevalences in the literature have ranged from 25% to 68% for stroke mimics, 24%–38% for non-LVO ischaemic strokes, 4%–16% for intracranial haemorrhages and 4%–15% for LVO strokes.10 11 24–26 Isolated M2 occlusions accounted for 33% of LVO strokes in our study and over 40% of occlusions in two larger studies with lower overall LVO prevalence than ours.10 11 Excluding M2 occlusions from our study would reduce the prevalence of LVO stroke to 9.1%. Knowledge of these estimated prevalences of LVO stroke among prehospital suspected stroke patients could help inform future prehospital triage modelling studies and triage test policy decisions when local data are not available.20 27
We sought to identify LVO prediction scale thresholds that met high PPV and NPV goals because predictive values are post-test probabilities of LVO stroke when the prevalence of diseases in a study is similar to that of the target population. Predictive values are strongly influenced by disease prevalence but are also affected by variations in test sensitivity and specificity.6–8 Our prespecified goal of finding thresholds with PPVs ≥80% was too optimistic given the relatively low prevalence of LVO stroke and the diagnostic performance of LVO scales. Only FAST-ED ≥7 met this goal, but its sensitivity was so low (17%) that it missed 83% of LVO strokes. We subsequently lowered our PPV goal to ≥50% in order to find scale thresholds where a positive test result would mean that the patient was equally or more likely to be suffering from LVO stroke than not. PASS =3, RACE ≥7 and FAST-ED ≥6 all met this goal, but none maintained a sensitivity ≥50%. Our prespecified analysis to find scale thresholds with NPVs ≥95% for LVO stroke identified multiple standard and alternative thresholds (table 2).
With high alternative FAST-ED thresholds meeting our PPV goals, although with markedly low sensitivities, and the standard FAST-ED threshold ≥4 standing out as the only threshold to achieve >70% sensitivity and specificity simultaneously, it is tempting to conclude that FAST-ED might outperform other scales. However, these findings should be considered with caution for two reasons. First, Nguyen et al studied FAST-ED ≥4 in a larger prospective study in ambulances with EMS providers performing the examination and found that it performed similarly (60% sensitivity and 85% specificity) to C-STAT, PASS, G-FAST and RACE at their standard thresholds.10 Second, our results could be due to the FAST-ED training given to ED physicians as part of the Mission Protocol quality improvement initiative. The protocol had instructions for ED providers to use FAST-ED as part of their initial assessment and document it. However, this was not routinely done in practice and was very rarely documented. Training was not provided for other scales. The NIHSS subitem scores used in this study to score LVO prediction scales were obtained by neurologists without FAST-ED training; however, their examinations could have been influenced by discussions with ED providers. While this is a limitation of our study, it could also suggest that dedicated training might improve sensitivity and specificity in the ED.
Our results suggest that given the prevalence of LVO stroke among prehospital suspected stroke patients and the sensitivity and specificity tradeoffs of LVO prediction scales, no single scale threshold tested here will likely be able to guide prehospital stroke triage efficiently by itself. Attempts to reach PPVs near 50% by selecting higher than standard thresholds will result in many false-negative missed LVO strokes (figure 2, top right). While several standard thresholds and many lower alternative thresholds can reduce the probability of LVO stroke when tests are negative, this will be accompanied by many false positives. EMS systems that already use the CPSS as a binary initial stroke screen and choose to focus on avoiding missed LVOs could readily adopt CPSS ≥2 as an LVO prediction scale without training personnel to use a new scale. CIs in our study were wide, especially with thresholds that met high PPV goals, but our findings were predominantly in line with larger prospective prehospital validation studies assessing multiple scales simultaneously.10 11
Our primary analysis focused on a definition of LVO stroke that included ICA, M1, M2 and basilar occlusions. Our exploratory analysis that excluded M2 occlusions from the definition of LVO stroke (figures 2 and 3, top left) showed that standard thresholds may not miss many ICA, M1 or basilar occlusions (high sensitivity); however, the corresponding proportion of positive tests with these occlusions (PPV) will be low. It is reassuring that excluding M2s increases the sensitivities of some standard thresholds for ICA, M1 or basilar occlusions into the 80%–90% range as more proximal occlusions are more reliably amenable to EVT. ICA and M1 occlusions are also more morbid and benefit from the strongest evidence base for EVT.28 29 Though more distal MCA occlusions have a higher recanalisation rate with thrombolysis, it is only in the 30% range.30 Registry study data support the benefit of EVT for M2 occlusions found in clinical practice, however, 2019 AHA/ASA guidelines currently provide only a class IIb recommendation.29 Patients presenting with non-disabling symptoms or distal M2 occlusions may still represent situations with EVT equipoise. The Australian and New Zealand Clinical Guidelines for Stroke Management suggest EVT may be considered ‘based on individual patient and advanced imaging factors’.31 As noted above, M2s have comprised a significant proportion of LVOs in studies with prehospital suspected stroke patients (33% in our study and over 40% in two others) so the development of prehospital diagnostic tests that are sensitive for them while retaining specificity would be beneficial. Several device-based approaches are under development to address the diagnostic limitations of LVO prediction scales, including by some of the current authors, but no devices have examined M2 occlusions in large numbers nor completed prehospital validation studies.32–34
Alternatively, broadening our definition of successful triage to include not only M2 occlusions but also intracranial haemorrhage results in high PPVs but low sensitivities. This may be reassuring to prehospital systems of care decision makers. Many of the ‘false positive’ non-LVO patients, when only ICA, M1 or basilar occlusions are counted as ‘true positives’, will be suffering from distal vessel occlusions or intracranial haemorrhage. These patients could also benefit from the frequent colocalisation of vascular and neurosurgical expertise at EVT centres. In health systems that can accommodate the added patient volume, there may be little downside to overtriage, especially where thrombolysis door to needle times are faster at EVT centres than non-EVT centres. Though controversial, map-based modelling studies analysing the USA and Canada suggest that prehospital bypass of non-EVT centres may benefit even thrombolysis eligible suspected LVO patients unless local non-EVT centres can provide door to needle times of 30 min or less.35
When examining the exclusion of M2s or addition of intracranial haemorrhages, it is important to note that changing the reference standard does not change patient-level test results and as a result does not affect patient-level triage decisions. For example, in each analysis, the number of patients with positive and negative CPSS =3 test results remains constant at 60 positives and 124 negatives (online supplemental tables 5–8). When the reference standard is changed from LVO stroke alone to LVO stroke and intracranial haemorrhage combined, the same patients still have positive and negative CPSS =3 test results, but the number of true positives, false negatives, false positives and true negatives changes. This in turn leads to different PPV, NPV, sensitivity and specificity results.
There are important limitations to our study. We only included EMS suspected stroke CPSS positive patients with LKW times of 6 hours or less that were brought to ZSFG over the course of 1 year. The prevalence of disease may vary by region, and it is not clear if scale performance would differ in the 6–24-hour stroke time window. At the time of our study, San Francisco was not using a prehospital triage system to divert patients with possible LVO stroke to EVT centres. However, it is possible that the Mission Protocol quality improvement effort at ZSFG, which included EMS outreach and education programmes, could have led to unmeasured changes in EMS routing patterns for suspected stroke patients that could bias the prevalence estimates described here.
The diagnostic performance portion of our study also excluded patients without NIHSS scores documented on ED arrival. This led to a disproportionate exclusion of patients with intracranial haemorrhage. This should be considered when interpreting our primary LVO stroke analysis and our exploratory analyses that included variations of LVO stroke and intracranial haemorrhage as combined reference standards.
Most importantly, our LVO prediction scales were retrospectively calculated from prospectively recorded NIHSS scores performed by neurologists in the ED rather than prehospital EMS providers prior to transport. While this allowed us to compare many scales at various thresholds, it does not represent the performance of scales as used by EMS providers in the prehospital setting. In addition, neurological examination changes can occur between EMS assessments and ED arrival.36 Our use of NIHSS scores also precluded us from testing promising scales such as the ambulance clinical triage for acute stroke treatment (ACT-FAST) algorithm due to its stepwise algorithm approach and the Los Angeles Motor Scale (LAMS) due to the absence of handgrip data.37 38 A recent multisociety consensus statement recommended maximum EMS travel times during LVO stroke triage that are tailored to urban, suburban and rural settings.39 However, there are no consensus PPV, NPV, sensitivity or specificity goals for prehospital LVO stroke triage. This led us to create PPV and NPV goals that we thought were clinically reasonable, given the prevalence of LVO stroke. We also considered a secondary analysis using an NPV goal of ≥99%. However, only the lowest alternative scale thresholds met this goal, and none did so with a specificity ≥25%.
Our study has several strengths. First, our use of consecutive prehospital stroke alerts over the entire study period allowed us to better estimate the prevalence of disease among suspected stroke patients identified by EMS providers in the prehospital setting. Second, we compared a wide range of LVO prediction scale thresholds rather than limiting our analysis to standard thresholds. In some cases, standard thresholds originally thought to be more sensitive than specific have subsequently been found to be more specific than sensitive.10 11 22 We propose that selecting thresholds that meet future consensus goals will be more valuable than a focus on standard thresholds. High NPV or sensitivity goals should likely be favoured for LVO stroke given the profound yet time-sensitive benefit of EVT as well as the association of transfers from non-EVT centres to EVT centres with worse outcomes.1 4 5 7
Finally, our study did not attempt to derive a new LVO prediction scale and instead focused on the external validation of multiple scales. Although our assessments occurred in an ED, all patients were identified as suspected stroke patients by EMS providers in the prehospital setting.
In conclusion, our data were consistent with others suggesting that the prevalence of LVO stroke among unselected prehospital suspected stroke patients is low. Prevalence is a key factor in the performance of LVO prediction scales. High alternative LVO prediction scale thresholds were required to meet a PPV goal of ≥50%, but these thresholds missed most LVO strokes. Including intracranial haemorrhages as true positives increased the number of scales that could provide PPVs ≥50%. Several standard thresholds and many alternative lower thresholds provided NPVs ≥95%, including CPSS ≥2, though false positives were common. EMS systems already using the CPSS as a binary initial stroke screen could also adopt it as a high NPV LVO triage prediction scale without having to incorporate an additional stroke scale. The limitations of these neurological examination-based tests support the need for further investigation of alternative approaches to prehospital LVO stroke identification, such as Mobile Stroke Units and portable LVO stroke diagnostic devices.34 In the meantime, implementation of LVO prediction scales still may benefit correctly classified patients more than prehospital systems that do not attempt prehospital LVO stroke triage.
Data availability statement
Data are available upon reasonable request.
Ethics statements
Patient consent for publication
Ethics approval
This study involves human participants and was approved by University of California, San Francisco. A waiver of consent was approved for this retrospective study of patients identified through a stroke registry.
References
Supplementary materials
Supplementary Data
This web only file has been produced by the BMJ Publishing Group from an electronic file supplied by the author(s) and has not been edited for content.
Footnotes
Contributors KJK, WSS, JCH and DYM conceived of the study and designed the protocol. KJK, SBC, CM and DYM collected the data. KJK analysed the data and wrote the manuscript, including figures, with input from all coauthors. KJK is the guarantor for the study.
Funding KJK’s research effort was supported by the NIH StrokeNet Fellowship through grants U10NS086494 and U24NS107229, the 2019 Clinician Scientist Development Three-Year Award in Interventional Neurology Funded by the Society of Vascular and Interventional Neurology and American Brain Foundation in collaboration with the American Academy of Neurology Institute, and the National Center for Advancing Translational Sciences, National Institutes of Health, through grant number UL1TR001860. The content is solely the responsibility of the authors and does not necessarily represent the official views of the NIH.
Competing interests KJK co-created the SAVE scale and is the principal investigator of an external validation study of a cranial accelerometry device for large vessel occlusion detection funded by the 2019 Clinician Scientist Development Award in Interventional Neurology funded by the Society of Vascular and Interventional Neurology and American Brain Foundation in collaboration with the American Academy of Neurology Institute. WSS co-created the SAVE scale and has ownership interest in MindRhythm, which is developing the above cranial accelerometry device, and consulted for and owns stock in Cerebrotech, Inc.
Provenance and peer review Not commissioned; externally peer reviewed.
Supplemental material This content has been supplied by the author(s). It has not been vetted by BMJ Publishing Group Limited (BMJ) and may not have been peer-reviewed. Any opinions or recommendations discussed are solely those of the author(s) and are not endorsed by BMJ. BMJ disclaims all liability and responsibility arising from any reliance placed on the content. Where the content includes any translated material, BMJ does not warrant the accuracy and reliability of the translations (including but not limited to local regulations, clinical guidelines, terminology, drug names and drug dosages), and is not responsible for any error and/or omissions arising from translation and adaptation or otherwise.