Article Text

Abstract
Background Myelin loss and cerebral blood flow (CBF) decline are central features of several neurodegenerative diseases. Myelin maintenance through oligodendrocyte metabolism is an energy-demanding process, so that myelin homeostasis is particularly sensitive to hypoxia, hypoperfusion or ischaemia. However, in spite of its central importance, little is known about the association between blood supply and myelin integrity.
Objective To assess associations between cortical and subcortical CBF, and subcortical myelin content, in critical brain white matter regions.
Materials and methods MRI was performed on a cohort of 67 cognitively unimpaired adults. Using advanced MRI methodology, we measured whole-brain longitudinal and transverse relaxation rates (R1 and R2), sensitive but non-specific markers of myelin content, and myelin water fraction (MWF), a direct surrogate of myelin content, as well as regional CBF, from each of these participants.
Results All quantitative relaxometry metrics were positively associated with CBF in all brain regions evaluated. These associations between MWF or R1 and CBF, and, to a lesser extent, between R2 and CBF, were statistically significant in most brain regions examined, indicating that lower regional cortical or subcortical CBF corresponds to a decrease in local subcortical myelin content. Finally, all relaxometry metrics exhibited a quadratic, inverted U-shaped, association with age; this is attributed to the development of myelination from young to middle age, followed by progressive loss of myelin in later years.
Conclusions In this first study examining the association between local blood supply and myelin integrity, we found that myelin content declines with CBF across a wide age range of cognitively normal subjects.
- myelin
- cerebral blood flow
- MRI
This is an open access article distributed in accordance with the Creative Commons Attribution Non Commercial (CC BY-NC 4.0) license, which permits others to distribute, remix, adapt, build upon this work non-commercially, and license their derivative works on different terms, provided the original work is properly cited, appropriate credit is given, any changes made indicated, and the use is non-commercial. See: http://creativecommons.org/licenses/by-nc/4.0/.
Statistics from Altmetric.com
Introduction
Production and maintenance of myelin integrity through oligodendrocytes is critical for saltatory conduction and normal axonal function. Indeed, accumulating evidence is establishing a close relationship between myelin degeneration and several neuropathologies, including multiple sclerosis and dementia.1 2 In animal studies, it has been shown that oligodendrocytes are vulnerable to blood flow deficits, and loss of these cells may occur rapidly in response to reductions in blood flow.3 Indeed, myelin maintenance through oligodendrocyte metabolism is an energy-intensive process, so that myelin homeostasis is particularly sensitive to hypoxia, hypoperfusion or ischaemia.4 In addition to substrate delivery, adequate cerebral blood flow (CBF) is crucial for removal of metabolic by-products and neurotoxins. The oligodendrocyte cells and myelin sheets are vulnerable to various insults, including iron accumulation as well as aggregations of tau and amyloid-beta proteins.5 Aside from potential neuronal damage, these insults can lead to loss of oligodendrocytes or impairment of their myelin synthetic capacity; this may result in deficits in myelin production and repair during turnover, or frank demyelination.
Growing evidence indicates that the breakdown of the myelin sheath may be an early phenomenon in neurodegeneration, including Alzheimer’s disease.1 6 7 Furthermore, there is evidence of a direct association between reduced brain perfusion and neurodegeneration.8 These findings suggest a positive association between hypoperfusion and white matter damage. Surprisingly, only a few magnetic resonance imaging (MRI)-based studies have examined the potential association between white matter integrity and CBF status. These studies have been limited to the context of leucoaraiosis, white matter lesions and Parkinson’s disease,8–10 all indicating that reduced CBF may induce brain tissue degeneration. However, association between blood supply and tissue integrity in unimpaired subjects has received very little attention. Yet evaluating the extent and patterns of this potential association in normal ageing is a critical step towards understanding the pathophysiological basis of the mechanisms and outcomes of neurological diseases.
Two previous pioneering MRI studies of the age-dependent relationship between CBF and white matter integrity have been conducted on healthy adults.11 12 Using diffusion tensor imaging (DTI) to assess white matter integrity and arterial spin labelling (ASL) to quantify CBF, Chen and colleagues11 found that cortical CBF is associated with white matter integrity, and a greater association of radial diffusivity, a DTI metric generally used to probe demyelination, with CBF, as compared with other DTI metrics; this was interpreted as an indicator of myelin degeneration. Furthermore, Giezendanner and colleagues12 found that subcortical CBF is associated with the integrity of different white matter tracts. All these compelling findings suggest that the blood supply to the brain may be an important determinant of white matter health in normal ageing. However, DTI outcomes, including fractional anisotropy and radial diffusivity, while sensitive to white matter microstructural changes, are not specific. Indeed, multiple factors aside from myelination can affect the DTI-derived eigenvalues from which fractional anisotropy, radial diffusivity and other DTI indices are derived; these include axonal degeneration, hydration, temperature, flow, macromolecular content and architectural features, including fibre fanning or crossing. The potential association of CBF with a more specific index of myelin content has not yet been undertaken.
Advanced MRI methods based on multicomponent relaxometry to assess myelin water fraction (MWF), a surrogate of myelin content, have led to much greater specificity in non-invasive MRI myelin mapping.2 13 14 We previously developed the Bayesian Monte Carlo multicomponent-driven equilibrium single pulse observation of T1 and T2 analysis (BMC-mcDESPOT) as an alternative approach to multicomponent relaxometry.15–17 This method provides rapid, accurate and precise whole-brain MWF maps,15–18 and has been used to provide quantitative evidence of myelin loss in mild cognitive impairment and dementia and to investigate myelination patterns in normative ageing.1 19 20
Here, we investigated the potential association between CBF and local myelin in a large cohort of well-characterised adults with no cognitive impairment (n=67), across the extended age range of 24–88 years. The inclusion of subjects across a wide age range ensures a large dynamic range for blood flow and myelin content measurements. Myelin content was measured using BMC-mcDESPOT-based MWF,16 17 a specific measure of myelin content, as well as longitudinal and transverse relaxation rates (R1 and R2), sensitive but non-specific myelin measures, to provide contact with previous studies.21–23 Indeed, R1 and R2 values depend on water mobility as well as macromolecular tissue composition, including local lipid and iron content; these are the main constituents of myelin. Therefore, changes in R1 and R2 are directly associated with microstructural changes, including changes in myelin content. CBF was measured using the nonlocal estimation of multispectral magnitudes (NESMA)-ASL analysis for accurate and precise CBF determination.24 Our goal is to characterise the regional associations between cortical or subcortical CBF and local myelination variations in critical white matter regions.
Materials and methods
Participants
Participants were drawn from the Genetic and Epigenetic Signatures of Translational Aging Laboratory Testing (GESTALT) study and the Baltimore Longitudinal Study of Aging (BLSA).25 26 The BLSA is a longitudinal cohort study conducted by the Intramural Research Program of the National Institute on Aging of community-dwelling adults with no major chronic conditions or functional impairments. The GESTALT study is also a study of healthy volunteers, also conducted by the Intramural Research Program of the National Institute on Aging. The inclusion and exclusion criteria for these two studies are essentially identical. Participants underwent testing and were excluded if they had metallic implants or neurological or medical disorders. All participants underwent a Mini Mental State Examination (MMSE) and achieved a score >25. The final cohort consisted of 67 cognitively unimpaired volunteers (mean±SD MMSE=29±1.2) ranging in age from 24 to 88 years (53±18.3 years), of whom 39 were men (52.7±18.7 years) and 28 were women (53.3±18.1 years), after exclusion of one participant with cognitive impairment. Age (p>0.1) and MMSE (p>0.1) did not differ significantly between men and women. The number of participants per age decade was 9 (4 women) within 20–29 years, 9 (3 women) within 30–39 years, 14 (6 women) within 40–49 years, 9 (3 women) within 50–59 years, 9 (6 women) within 60–69 years, 12 (4 women) within 70–79 years, and 5 (2 women) within 80–89 years. Participants provided written informed consent.
Data acquisition
MRI scans were performed on a 3T whole-body Philips MRI system (Achieva, Best, The Netherlands) using the internal quadrature body coil for transmission and an eight-channel phased-array head coil for reception. For each participant, the protocol for MWF and CBF imaging was as follows:
BMC-mcDESPOT for MWF mapping15–18: three-dimensional (3D) spoiled gradient recalled echo (SPGR) images were acquired with flip angles (FAs) of 2°, 4°, 6°, 8°, 10°, 12°, 14°, 16°, 18° and 20°, echo time (TE) of 1.37 ms, repetition time (TR) of ~5 ms and acquisition time of 5 min, as well as 3D balanced steady-state free precession (bSSFP) images acquired with FAs of 2°,4°, 7°, 11°, 16°, 24°, 32°, 40°, 50°and 60°, TE of 2.8 ms, TR of 5.8 ms and acquisition time of ~6 min. The bSSFP images were acquired with radiofrequency (RF) excitation pulse phase increments of 0° or 180° in order to account for the off-resonance effects.27 All SPGR and bSSFP images were acquired with an acquisition matrix of 150 × 130 × 94 and voxel size of 1.6 mm × 1.6 mm × 1.6 mm. To correct for RF inhomogeneity, the double-angle method (DAM) was used. This consisted of acquiring two fast spin echo images with FAs of 45° and 90°, TE of 102 ms, TR of 3000 ms, acquisition voxel size of 2.6 mm × 2.6 mm × 4 mm, and acquisition time of ~4 min. The total acquisition time was ~21 min.
Pseudo-continuous ASL (pCASL) for CBF mapping28: control, labelled and proton density (PD) images were acquired with incorporation of background suppression with field-of-view of 220 mm × 210 mm × 120 mm, spatial resolution of 2.5 mm × 2.5 mm × 5 mm, TE of 15 ms, TR of 7.5 s, labelling duration of 1.8 s, postlabelling delay of 2 s, and 30 signal averages. The total acquisition time was ~12 min.
All images were reconstructed to a voxel size of 1 mm × 1 mm × 1 mm. We note that the MRI scans and ancillary measurements were conducted at the same facility by the same investigators, with the same MRI system as well as the same pulse sequences.
Data processing
For each participant, a whole-brain MWF map was generated using the BMC-mcDESPOT analysis from the SPGR, bSSFP and DAM data sets.1 15–17 Briefly, BMC-mcDESPOT assumes a two-relaxation time component system consisting of a short component, attributed to myelin water, and a long component, attributed to intracellular/extracellular water. We used the signal model explicitly accounting for non-zero TE.15 A whole-brain R1 map was generated from the SPGR and DAM data sets using the DESPOT1 analysis and assuming a single component.29 A whole-brain R2 map was generated from the bSSFP and DAM data sets using the DESPOT2 analysis and again assuming a single component.29 Finally, a whole-brain CBF map was generated from the pCASL data set using the NESMA-ASL analysis to improve accuracy and precision in CBF determination.24 28
Further, using the FSL software,30 the averaged SPGR image over FAs was non-linearly registered to the Montreal Neurological Institute (MNI) standard space, and the computed transformation matrix was then applied to the corresponding MWF, R1 and R2 maps. Similarly, the PD image was non-linearly registered to the MNI space and the computed transformation matrix was then applied to the corresponding CBF map. FAST segmentation was also performed to generate white matter (WM) and cortical gray matter (GM) masks. Six regions of interest (ROIs) were defined from the MNI structural atlas corresponding to the whole brain, and the frontal, parietal, temporal and occipital lobes, and cerebellum. Within each ROI, the mean MWF, R1, R2 and CBF values were calculated. Analysis was restricted to WM ROIs for MWF, R1 and R2, and to cortical GM or WM for CBF; this is due to the small amount of myelin in GM, which imposes a well-recognised challenge for accurate myelin content determination.2 14 17
Statistical analysis
Our study and others’ have shown that myelination follows a significant quadratic association with age, while the effect of sex on myelination is non-significant.19 31 Therefore, for each ROI, the effect of CBF on MWF, R1 and R2 was investigated using multiple linear regression, with the mean MWF, R1 or R2 value as the dependent variable and the mean CBF value, age and age2 as the independent variables, after mean age centring. Whole-brain WM volume was included as an additional confounding variable. Correction for multiple ROI comparisons was performed using the false discovery rate (FDR) method, with the threshold for statistical significance set to p<0.05.32
Results
Figure 1 shows the MWF, R1, R2 and CBF maps derived from the brain of all participants within the youngest decade of our cohort, that is, between 24 and 29 years. This limited age range minimises the potential effect of age on derived values. Visual inspection indicates that, overall, participants with the smallest values for regional MWF, R1 or R2 exhibit the smallest regional CBF values, while participants with the highest regional MWF, R1 or R2 values exhibit the highest regional CBF values. These qualitative results indicate a potential association between CBF and myelin content variations, seen in all three of these MRI measures, but most directly through the MWF results.

Examples of MWF, R1, R2 and CBF maps of participants drawn from the limited age range between 24 and 29 years. Results are shown for a representative slice. Visual inspection indicates that, overall, participants with the lowest regional MWF, R1 or R2 values exhibit the lowest regional CBF values, while participants with the highest regional MWF, R1 or R2 values exhibit the highest regional CBF values. CBF, cerebral blood flow; MWF, myelin water fraction; R1, longitudinal relaxation rate; R2, transverse relaxation rate.
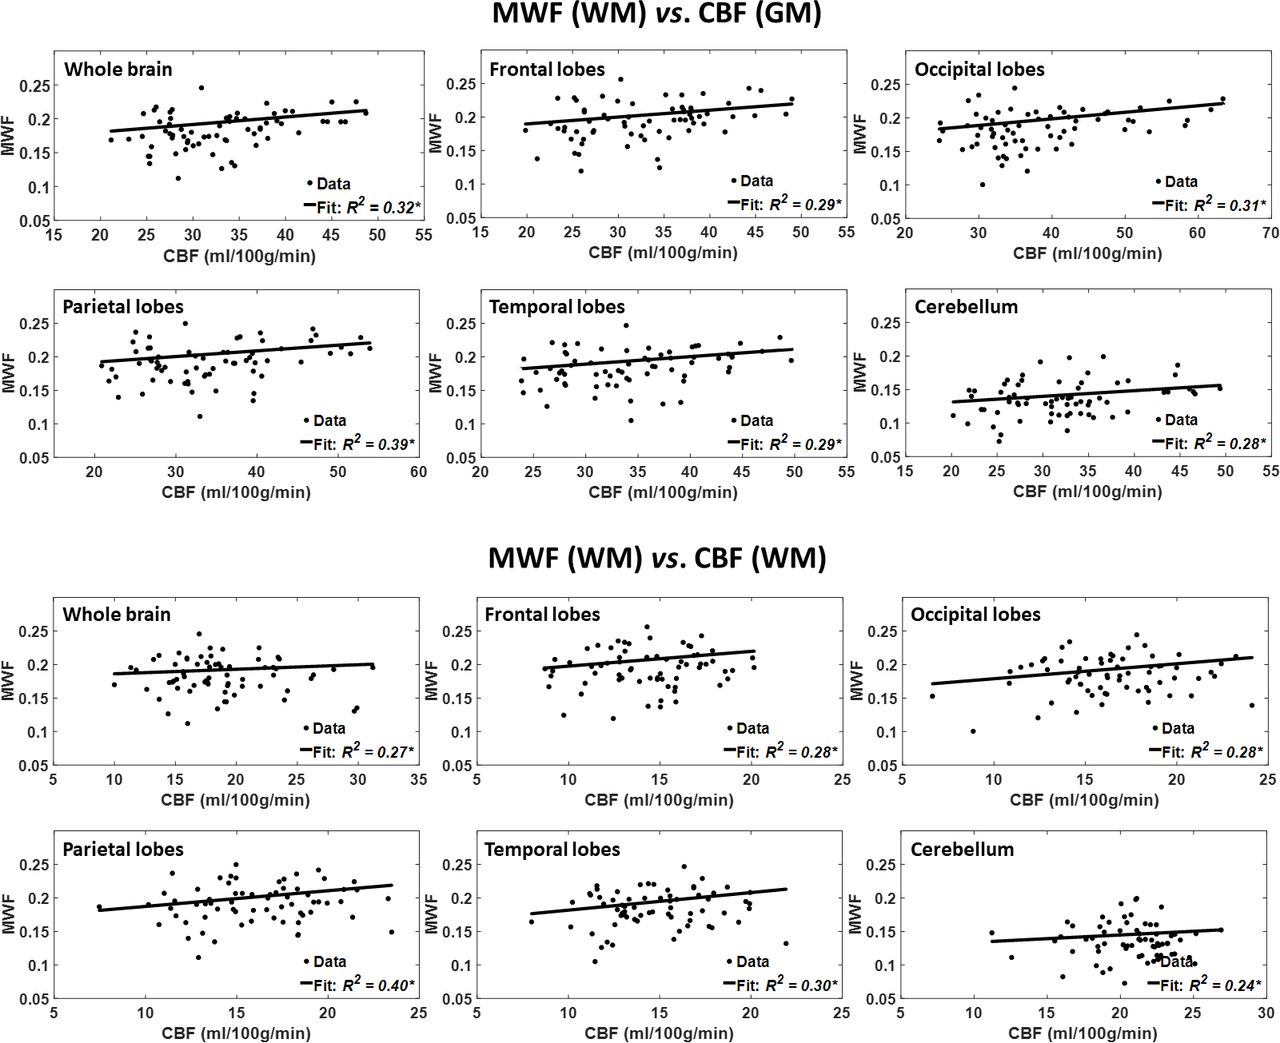
Figure 2 shows the results of the regressions of MWF with CBF, after adjusting for age and age2, for the six indicated WM and GM regions. As seen, decreased CBF corresponds to decreased MWF in all ROIs examined, with the best-fit curves displaying regional variation; these results agree with those shown in figure 1. Statistical analysis indicates that this positive correlation between MWF and CBF was statistically significant (pCBF<0.05) or close to significance (pCBF<0.1) in most WM and GM brain regions (table 1), with the exception of the ROIs defined by the whole-brain WM and the cerebellum WM. In addition, the greatest positive slopes in CBF with MWF were found in the frontal and temporal WM lobes regions, while the smallest slope was found in the whole-brain WM region. Comparison of these slopes indicated statistically significantly different slopes between the temporal WM lobes and the whole-brain WM region (p<0.05; Z-test computed as the difference between the two slopes divided by the square root of the sum of the squared SE of the slopes33). Furthermore, as expected, the effect of age was significant for all brain regions evaluated (table 1). Similarly, the quadratic effect of age, age2, was significant or close to significance in all brain regions (table 1).

Regressions of MWF with CBF (n=67). Results are shown for six brain ROIs associated with particular structures. For each ROI, results are shown for CBF values derived from grey or white matter. The coefficient of determination, R2, of the multiple linear regression model is reported with the symbol *, indicating significance at p<0.01. All ROIs exhibited significant positive correlations between MWF and CBF. Note that analysis was restricted to WM ROIs for MWF and to cortical GM or WM for CBF; this is due to the small amount of myelin in GM, which imposes a well-recognised challenge for accurate myelin content determination. CBF, cerebral blood flow; MWF, myelin water fraction; ROI, region of interest.
Significance (p value) of the regression terms incorporated in the multiple linear regression
Figure 3 shows the results of the regressions of R1 with CBF for the six indicated WM and GM regions. Visual inspection indicates that decreased CBF corresponds to decreased R1 in most of the ROIs examined, with the best-fit curves displaying regional variation, in agreement with the results presented in figure 1. The statistical analysis indicates that this positive correlation between R1 and CBF was statistically significant (pCBF<0.05) or close to significance (pCBF<0.1) in all WM and GM brain regions (table 1), except in the whole brain, parietal lobes and cerebellum WM and the frontal lobes GM. In addition, the greatest positive slopes in CBF with R1 were found in the frontal and temporal WM lobes regions, while the smallest slopes were found in the parietal lobes GM and cerebellum GM regions. Comparison of each of the greatest and smallest slopes indicated statistically significantly different slopes between temporal lobe WM and the parietal lobes GM and cerebellum GM. Furthermore, the main age effect was significant (page<0.05) in only one brain structure, namely the parietal lobes WM, after FDR correction (table 1). In addition to this region, the effect of age was significant or close to significance in the whole brain, frontal lobes, parietal lobes, temporal lobes WM, and the parietal lobes and temporal lobes GM before FDR correction. The quadratic effect of age, age2, was significant or close to significance in all brain regions except in the cerebellum WM (table 1).

Regressions of R1 with CBF (n=67). Results are shown for six brain ROIs associated with particular structures. For each ROI, results are shown for CBF values derived from grey or white matter. The coefficient of determination, R2, of the multiple linear regression model is reported with the symbol *, indicating significance at p<0.01. Except the whole brain and cerebellum WM, all ROIs exhibited significant positive correlations between R1 and CBF. Note that analysis was restricted to WM ROIs for R1 and to cortical GM or WM for CBF. CBF, cerebral blood flow; R1, longitudinal relaxation rate; ROI, region of interest.
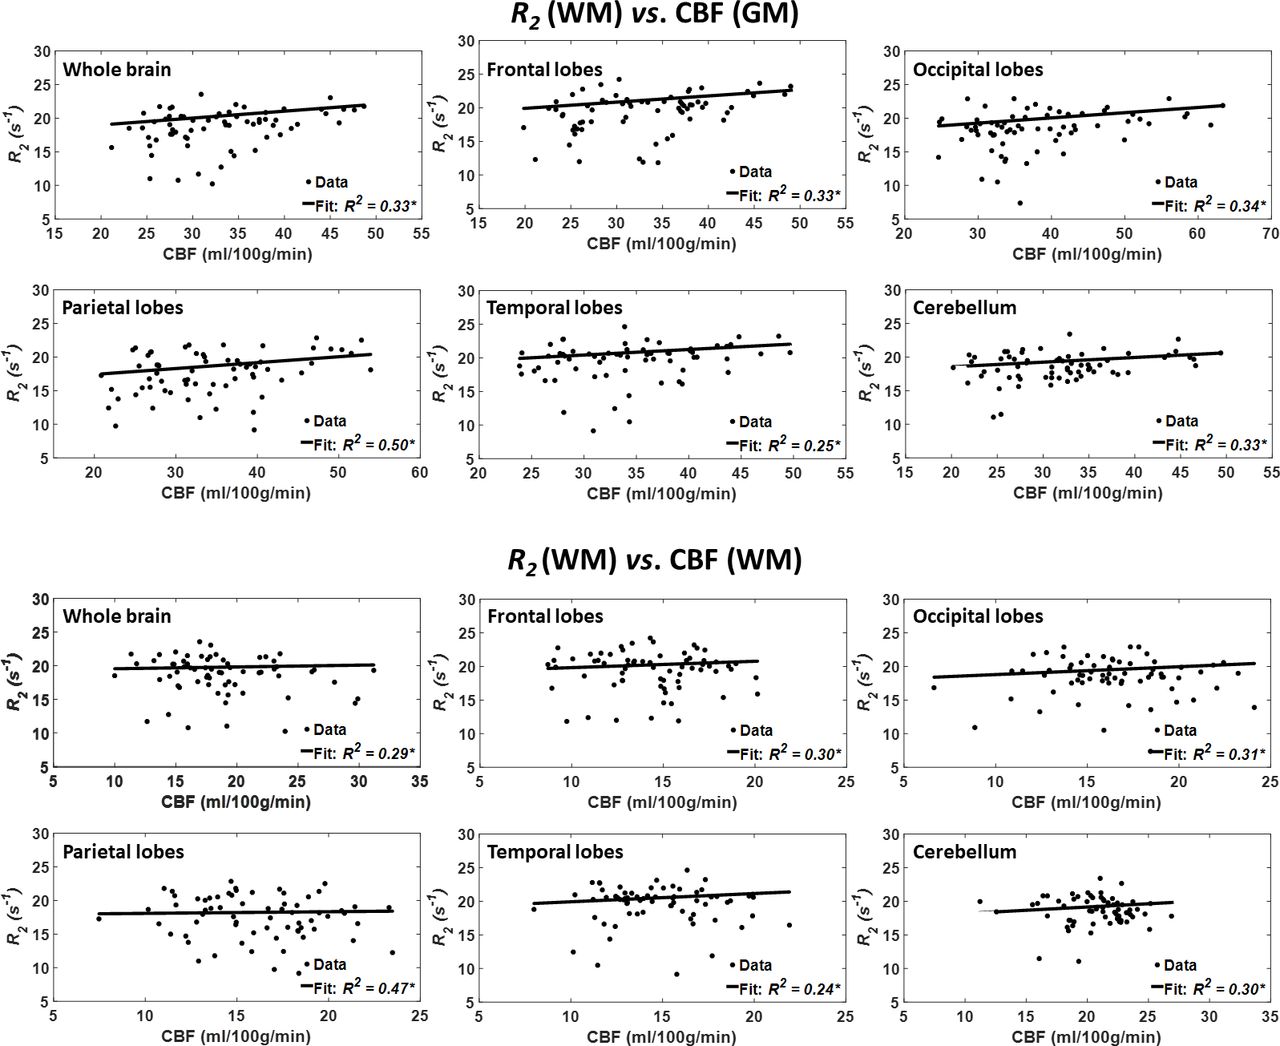
Figure 4 shows the results of the regressions of R2 with CBF for the indicated six WM and GM regions. As seen, decreased CBF corresponds to decreased R2 in most ROIs examined, with the best-fit curves displaying regional variation; these results are in overall agreement with figure 1. Statistical analysis indicates that this positive correlation between R2 and CBF was statistically close to significance (pCBF<0.1) in only three WM brain regions (table 1), namely the whole brain, the occipital lobes and the cerebellum GM. In addition, the greatest positive slope of CBF versus R2 was found in the temporal lobes WM, while the smallest slope was found in the parietal lobes WM. Comparison of the greatest and smallest slopes indicated non-significant differences. Furthermore, the main age effect was significant in all brain structures (table 1). Similarly, the effect of age2 was significant in all brain regions (table 1).

Regressions of R2 with CBF (n=67). Results are shown for six brain ROIs associated with particular structures. For each ROI, results are shown for CBF values derived from grey or white matter. The coefficient of determination, R2, of the multiple linear regression model is reported with the symbol *, indicating significance at p<0.01. All ROIs exhibited significant positive correlations between R2 and CBF. Note that analysis was restricted to WM ROIs for R2 and to cortical GM or WM for CBF. CBF, cerebral blood flow; R2, transverse relaxation rate; ROI, region of interest.
Discussion
Using advanced MRI methodology for myelin content quantification and CBF mapping, we have provided what we believe is the first demonstration of associations between cortical and subcortical variations in blood supply and a direct measure of myelin content. These associations were observed in a cohort of healthy subjects and were significant in critical brain regions. Notwithstanding the fact that these results do not prove causality, they provide evidence that limitations in CBF may lead to lower myelin content, thus linking neurovascular physiology and myelin integrity throughout normative ageing.
Although not specific to myelin content, R1 and R2 are very sensitive to myelin.1 21 We found significant regional decreases in R1 with CBF (figure 3, table 1). This further supports our hypothesis of potential associations between CBF and myelin content as measured using a direct and specific myelin content measure, MWF (figure 2, table 1). Indeed, while not specific to myelin content, R1 is sensitive to lipid content,21 the main constituent of myelin. Of note, this association was less pronounced between CBF and R2 (figure 4, table 1); this is expected since R2 is sensitive to other tissue properties including hydration, macromolecular content, temperature and flow, while being less sensitive to lipids.21 Studies have indicated that the R2 to R1 ratio could serve as a sensitive metric of myelin content. Our analysis, detailed in the online supplementary material, indicates non-significant correlation between R2/R1 and CBF in all ROIs (online supplementary table 1). Interestingly, unlike MWF, R1 and R2, there was no significant correlation between R2/R1 and age2 (online supplementary table 1). These results indicate that the R2 to R1 ratio may be less sensitive than MWF as a marker of myelin. In fact, we observed only low-to-modest regional correlations between R2/ R1 and MWF (online supplementary figure 1); this agrees with the recent observation of Uddin and colleagues.34
Supplemental material
Our results also indicate an inverted U-shaped association of MWF with age in all cerebral ROIs investigated (table 1), consistent with our previous study of a larger cohort of participants with no cognitive impairment, and with other previous work.19 31 We attribute this association to myelination from youth through middle age, followed by demyelination in later years,23 31 in agreement with postmortem observations35 and with different investigations based on myelin-sensitive, but non-specific, quantitative MRI methods such as DTI or relaxometry.22 23 36
We found that the brain regions investigated exhibited different trends of CBF versus myelination. Indeed, autopsy studies of human brain microvasculature have revealed a complex brain vascular system exhibiting regional differences in blood supply.37 This complex vascular network offers some protection to certain cerebral structures, while leaving other areas vulnerable to chronic hypoperfusion, especially the deep white matter regions.37 Moreover, studies have shown that, overall, the occipital lobes exhibit delayed demyelination as compared with the other lobes.19 31 This pattern is consistent with the retrogenesis paradigm (last-in-first-out hypothesis) which suggests that, compared with anterior regions, the posterior brain regions are spared from neurodegeneration. Interestingly, the greatest slopes of CBF versus myelination were in the anterior lobes, indicating a more rapid MWF decrease with CBF decline compared with the more posterior regions investigated. However, larger cohorts and longitudinal follow-up are needed to draw definitive conclusions regarding regional differences in the association of CBF with myelination. Finally, given the emerging concept of a possibly causative association of demyelination with cognitive impairment,7 our work, although carried out in a normatively ageing cohort, further indicates the potential significance of decreased CBF in the development of cognitive impairment, including dementia.
Our calculated MWF mean values were overall in good agreement with those previously reported.19 31 However, we note that mcDESPOT, including BMC-mcDESPOT, provides somewhat higher MWF values as compared with multiple spin echo (MSE)-based methods.38 Indeed, various experimental and physiological factors, which are not considered in the MSE or mcDESPOT signal models, could be involved in this discrepancy. This includes, but is not limited to, the effects of magnetisation transfer between macromolecules and free water protons, longitudinal relaxation time resulting from use of short repetition times in MSE, exchange between water pools, J-coupling, off-resonance, spin locking, water diffusion within different compartments, and internal gradients. These represent major challenges in MRI studies of myelin content, and further technical developments are required to improve accuracy of myelin imaging. Indeed, comprehensive comparison analyses between BMC-mcDESPOT and MSE-decay curve MWF measurements are needed.18 38
Although our investigation examines a relatively large cohort and uses advanced MRI methodology, our work has limitations. Our data set is cross-sectional, with additional longitudinal studies being required to further establish the potential causality of the CBF and MWF associations observed here. Such work, motivated by the present results, is under way. Furthermore, we used identical ASL experimental parameters for all subjects, and acquired CBF images at a single postlabelling delay; this assumes negligible effects of spatial variation in arterial transit time (ATT), the time of the arterial bolus to transit from the labelling plane to the imaging volume. Although this is a reasonable assumption,28 ATT may vary spatially and may differ between subjects due to arterial blood velocity differences39; this could introduce a small bias in derived CBF values. A multiple postlabelling delay ASL technique may provide more accurate CBF determination.39 Moreover, certain physiological and experimental parameters could bias MWF determination as discussed above. Finally, a number of physiological parameters such as body mass, blood pressure, blood lipids, insulin resistance and inflammatory markers could affect myelin content as well, although a meaningful study of these variables would require a much larger cohort size than in the present study.
References
Footnotes
MB, JSRA and NK contributed equally.
Contributors MB, LF, SMR, RGS: research design, analysis, paper writing. JSRA, NK, RWK, ACR, LEC, WQ: analysis, paper writing. MB, JSRA and NK contributed equally to this paper.
Funding The Intramural Research Program of the NIA of the NIH supported this work.
Competing interests None declared.
Patient consent for publication Not required.
Ethics approval The MRI protocol was approved by the MedStar Research Institute and the National Institutes of Health Intramural Ethics Committees, and all examinations were performed in compliance with the standards established by the National Institutes of Health Institutional Review Board.
Provenance and peer review Not commissioned; externally peer reviewed.
Data availability statement Data are available upon reasonable request.